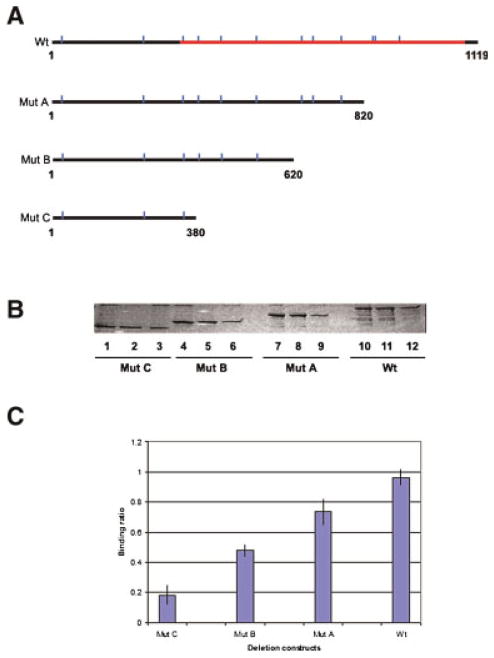
Figure 6.
Determination of the Ni2+-binding domain of glutamate–ammonia ligase protein. A: Diagram showing the positions of histidine residues in GLUL. Indicated are the sizes of recombinant deletion mutant proteins produced. Vertical lines, histidines. The GLUL catalytic domain is indicated. B: Nickel affinity binding and SDS–PAGE. Lanes 1–3, GST–GLUL protein mutant C (41 kDa, spanning nucleotides 1–380). Lanes 4–6, GST–GLUL protein mutant B (50 kDa, spanning nucleotides 1–620). Lanes 7–9, GST–GLUL protein mutant A (57 kDa, spanning nucleotides 1–820). Lanes 10–12, GST–GLUL full length (68 kDa, spanning nucleotides 1–1,119). Lanes 1, 4, 7, and 10, input protein samples. Lanes 2, 5, 8, and 11, protein bound to Ni-NTA agarose beads. Lanes 3, 6, 9, and 12, flow through proteins. C: Quantification of nickel-binding activity of deletion mutants and full length GLUL protein. After nickel binding and SDS–PAGE, the intensity of each fractionated protein band was quantified. The diagram shows the average ratio of the intensity of each eluted protein band vs. the input protein band from three independent experiments. [Color figure can be viewed in the online issue, which is available at wileyonlinelibrary.com]

