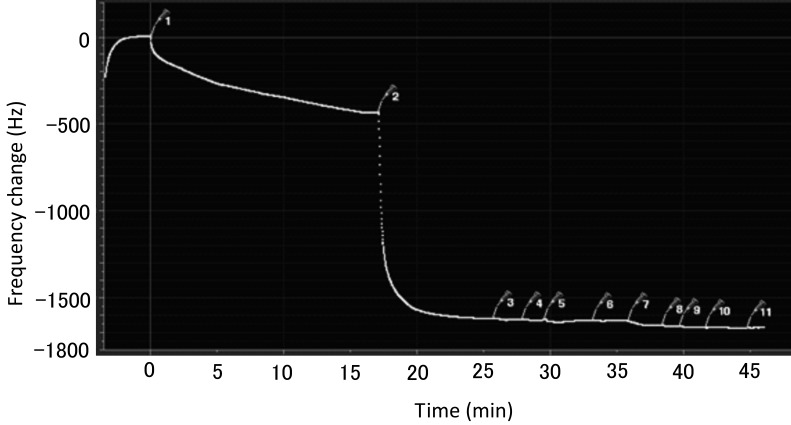
Fig. 6.
Intermolecular interaction of EGCG and streptococcal LTA. This is one of the most typical data, in that the same experiment done three times. The numbers in the figure represent injecting times. 1, 5 µl of EGCG. 2, 5 µl of block agent. The numbers of 3 to 11 represent injected each 5 µl of streptococcal LTA.

