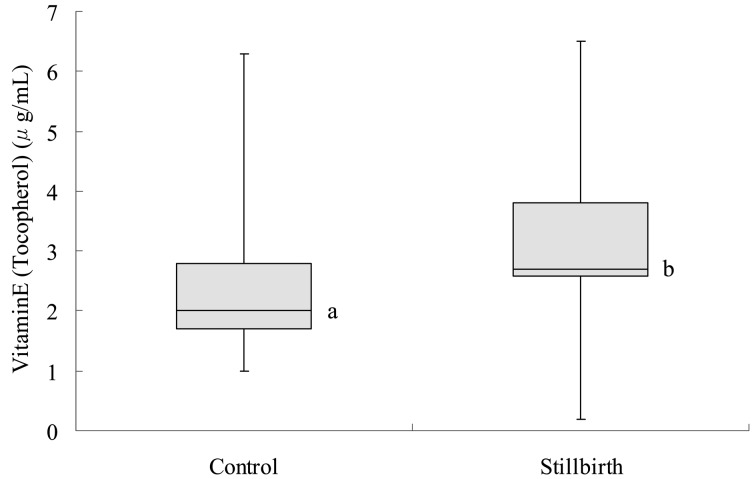
Fig. 3.
Vitamin E (tocopherol) in normally calving cows (control) and cows with stillbirth (stillbirth). a,b: Significant difference between the two groups (P<0.05). In the box plot, the horizontal line represents the median, and the whiskers indicate the lowest and highest data points that are within 1.5 the interquartile range.

