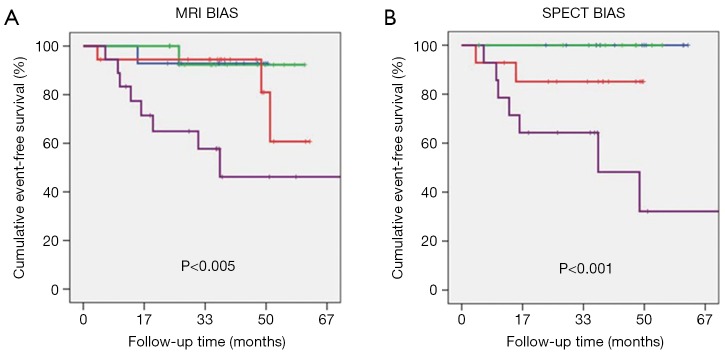
Figure 2.
Kaplan-Meir plots are shown for MACE for (A) tiles of MRI BIAS score and (B) tiles of SPECT BIAS score with green, blue, red, and purple, for tiles 1, 2, 3, and 4, respectively. MACE, major adverse cardiovascular; BIAS, bio-informatics assessment schema; MRI, magnetic resonance imaging; SPECT, single photon emission computed tomography.

