
Figure 2.
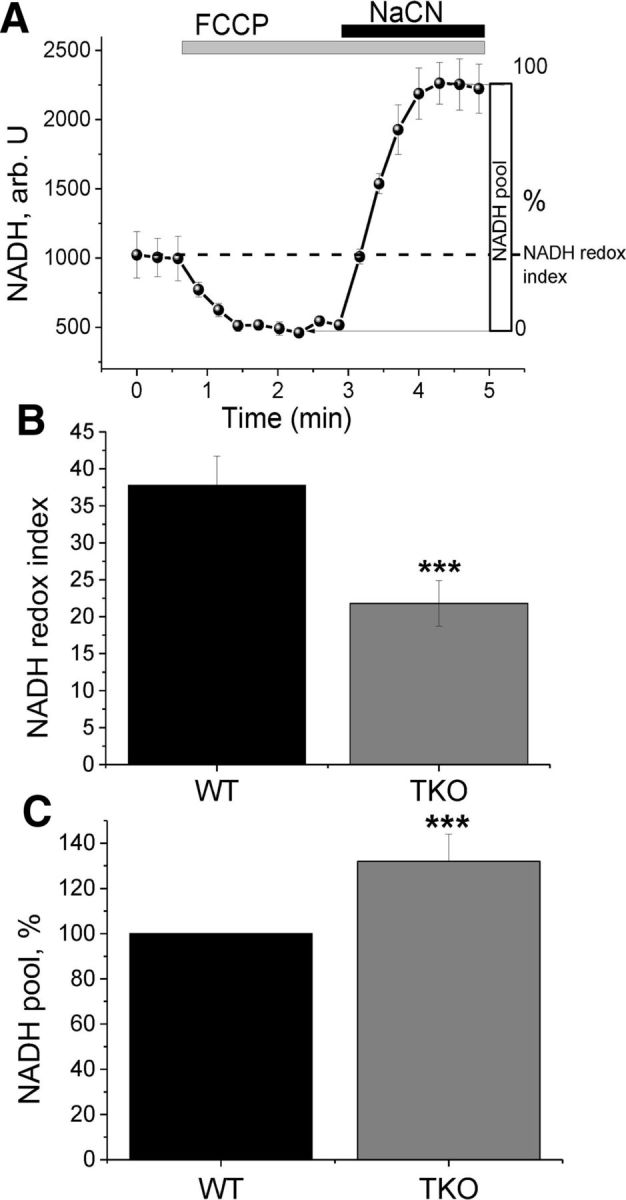
NADH autofluorescence measurements reveal increased respiration in TKO cells. A, Representative traces of NADH in healthy cells. FCCP (1 μm) is applied to maximize respiration and therefore minimize the NADH pool; NaCN (1 mm) is added to block the mitochondrial respiration and therefore maximize the NADH pool. B, Redox index is significantly lower in TKO compared with WT cells. C, Mitochondrial pool of NADH is significantly larger in TKO compared with WT cells, indicating normal substrate supply. *p < 0.05; ***p < 0.001; n = 3 experiments.