
Figure 5.
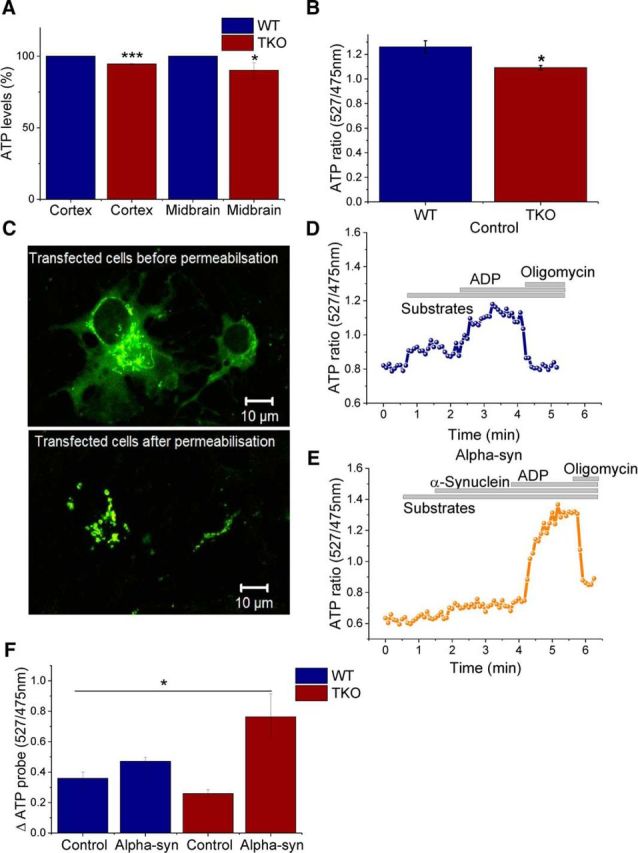
ATP levels in TKO brain tissue are significantly lower compared with WT. A, Quantification of ATP levels in WT and TKO cortex and midbrain tissue by colorimetric measurements (n = 3). B, Quantification of basal ATP levels in WT and TKO neuronal cocultures using a FRET-based mitochondrial ATP probe (n = 5). C, Representative images of cells transfected with the mitochondrial ATP probe before and after permeabilization. D, E, Representative trace of kinetic changes in mitochondrial ATP of WT cells in the presence of mitochondrial substrates (malate/glutamate), ADP, and oligomycin in the absence (D) or presence (E) of monomeric α-synuclein. F, ATP amplitude quantification upon ADP application in the presence or absence of monomeric α-synuclein in WT or TKO (n ≥ 4). *p < 0.05; ***p < 0.00. Scale bar, 10 μm.