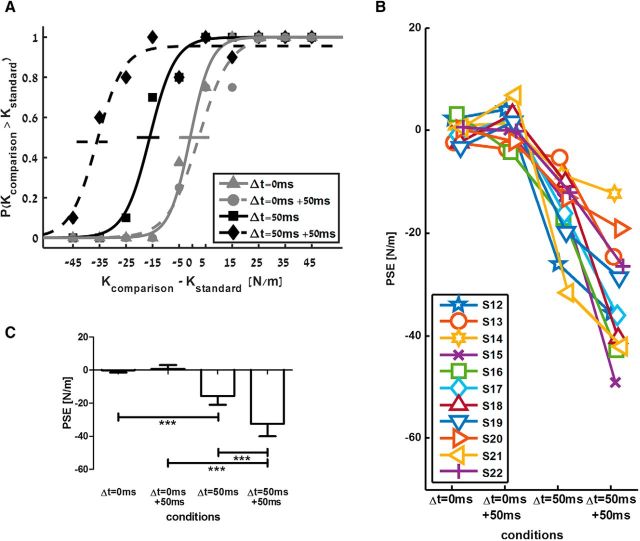
Figure 8.
Increased external delay between force and position signals mimics the effect of cTBS. A, Psychometric curves fitted to the answers of a typical participant in the control session (solid lines) and in the session with the added delay (+50 ms; dashed lines). B, Individual PSE values across all participants for the four conditions. C, Mean PSE values across all participants for the four conditions. Error bars are 95% confidence intervals estimated using t distribution. ***p < 0.001.

