Figure 1.

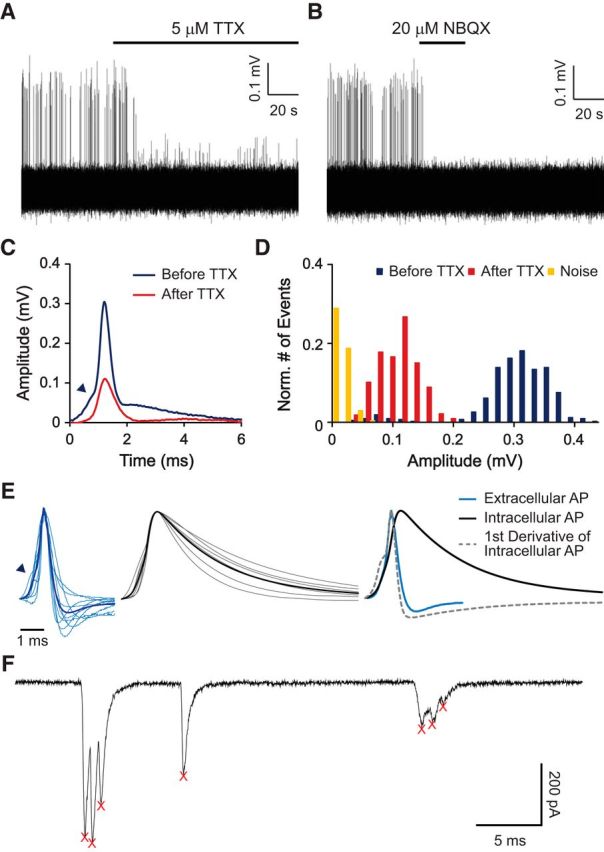
APs can be unambiguously identified in loose-patch extracellular recordings. A, B, Representative traces of a loose-patch extracellular recording from an ANF ending. Spikes in the recording were blocked by TTX (A). Remaining smaller events were blocked by NBQX in the same fiber (applied previously and washed out), and thereby identified as EPSPs (B). C, Average waveform of spikes in A shows inflection in the rising phase (arrowhead). D, Amplitude histogram with normalized numbers of APs (blue), EPSPs (red), and noise (yellow) showing a clear separation of these three groups. E, Superimposed extracellularly recorded spikes from 10 ANFs (left in light blue), intracellularly recorded spikes from 6 ANFs (middle in gray), and their average waveforms (left in dark blue and middle in black). At right, the average waveforms are compared, along with the scaled first derivative of the intracellular waveform. Note the similarity of the first derivative with the extracellular waveform. F, Whole-cell voltage-clamp recording from an ANF bouton showing typical spontaneous EPSCs. Two EPSCs are “multiphasic” with several peaks and one is “monophasic,” with a single peak. Detected event times are marked with red X's. Holding potential was −99 mV.
