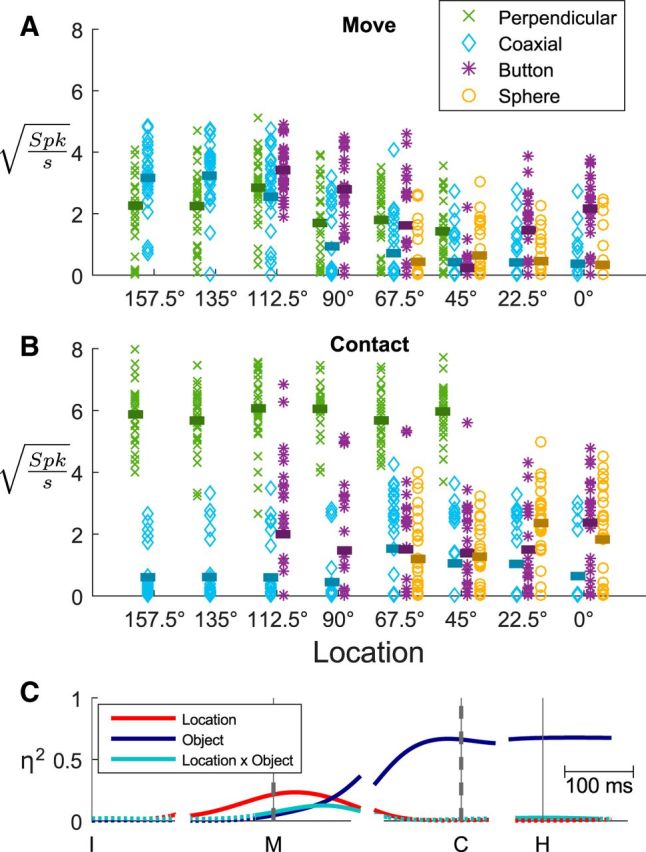
Figure 3.

Variation in firing rates. A, For each successful trial, the firing rate of the neuron illustrated in Figure 2 at the time of movement onset has been plotted against location, with different objects represented by different symbols as indicated in the legend. Horizontal bars indicate the mean firing rate for each location–object combination. At movement onset, this unit's firing rate varied predominantly with location. B, The same neuron's firing rate has been plotted in the same fashion as A, but here using firing rates from the same trials at the time of peripheral object contact. At this time the neuron's firing rate varied predominantly with object. C, The sizes (η2) of location, object, and location × object interaction effects each have been plotted as a function of time around each behavioral event (vertical lines). Dashed vertical lines at M and C emphasize the times for which the firing rates from individual trials are shown in A and B, respectively. Solid lines indicate statistically significant effects; dotted lines indicate when effects were not significant.
