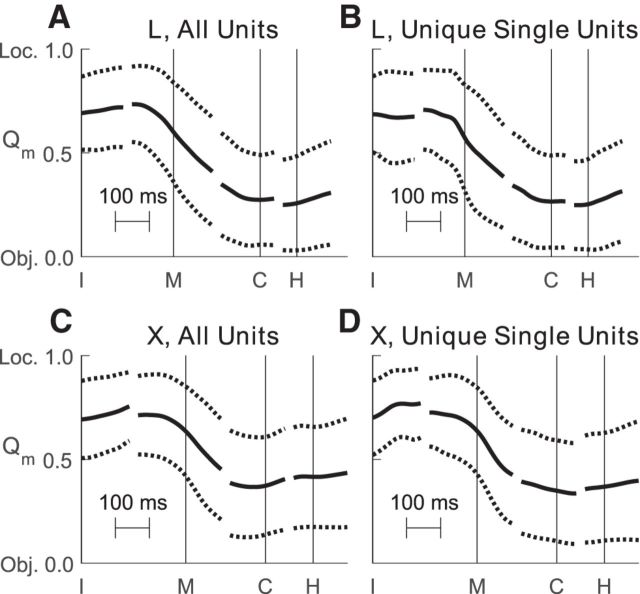
Figure 5.
Time course of Qm. Each panel shows the average time course (mean ± SD) of Qm, an index that quantifies the relative size of location versus object main effects. Qm is 1 if all task-related, main-effect variance is related to location, is 0.5 if location-related and object-related variance are equal, and is 0 if all such variance is related to object. Qm is independent of the variance attributed to error (noise). All data have been aligned separately on the times of four behavioral events—instruction (I), movement onset (M), peripheral object contact (C), and beginning of final hold (H)—indicated by the vertical lines in each plot. A, All sorted units from monkey L. B, Unique single units from monkey L. C, All sorted units from monkey X. D, Unique single units from monkey X. In all four groups of units, average Qm initially indicated larger location than object effects, but began to decrease before movement onset (M) and indicated larger object than location effects by the time of peripheral object contact (C).

