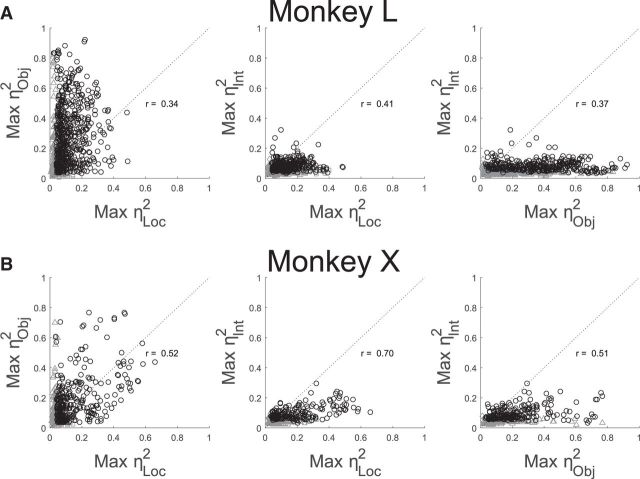
Figure 7.
Pairwise scatterplots of maximal location, object, and interaction effect sizes. A, All sorted units from monkey L. B, All sorted units from monkey X. Black circles indicate that the maximum η2 was significant for both plotted factors. Gray symbols indicate that only one of the two factors was significant: Squares, Significant location effect; triangles, significant object effect; diamonds, significant interaction effect. Clusters of gray points close to the origin in each plot represent units for which neither plotted factor was significant at any analyzed time. Note that the sum of the maximum η2 for two factors can exceed 1 because the two were not simultaneous values.

