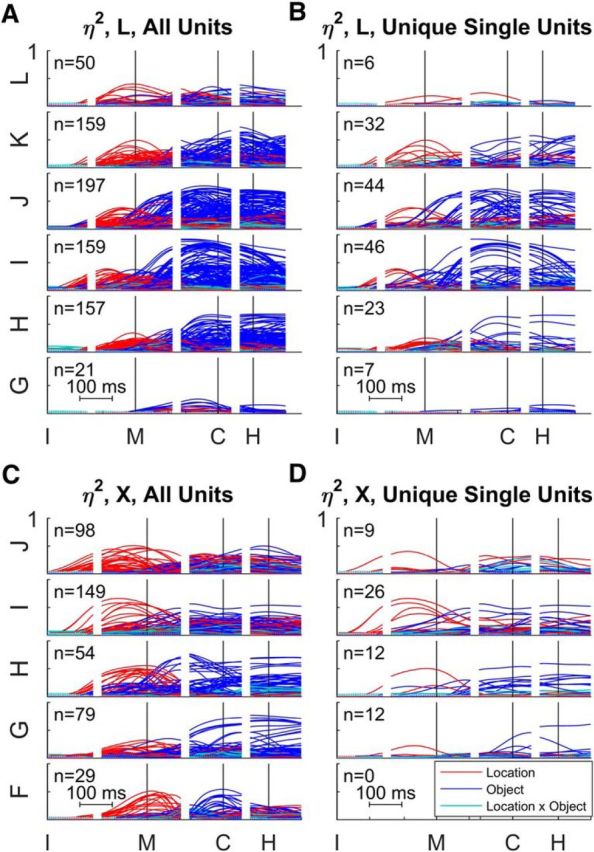
Figure 8.

Time-resolved ANOVA by array. A, All sorted units from monkey L. B, Unique single units from monkey L. C, All sorted units from monkey X. D, Unique single units from monkey X. For each monkey, the arrays have been arranged in reverse alphabetical order from most medial above to most lateral below: L–G for monkey L, J–F for monkey X. Each plot shows the time-varying location (red), object (blue), and location × object interaction (cyan) effect size (η2) for each unit. All data have been aligned separately on the times of four behavioral events: instruction (I), movement onset (M), peripheral object contact (C), and beginning of final hold (H). Note that in monkey X no definite single units were obtained from the most lateral array, F.
