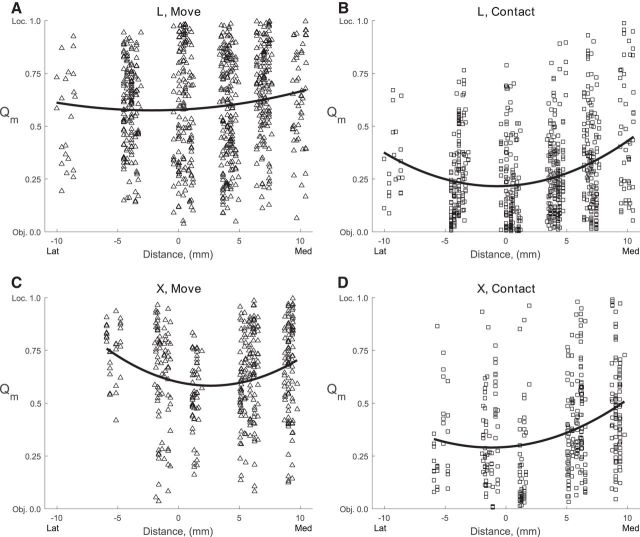
Figure 9.
Qm as a function of mediolateral location. The Qm ratio has been plotted for all sorted units from each monkey (L, top row; X, bottom row) at the time of two behavioral events (movement, left column; peripheral object contact, right column). Qm values could range from 0 (only object effect) to 1 (only location effect), and have been plotted here as a function of mediolateral recording site location [lateral (left) to medial (right)]. The parabolas represent the quadratic best-fit to Qm values versus mediolateral location for each monkey at each time point.

