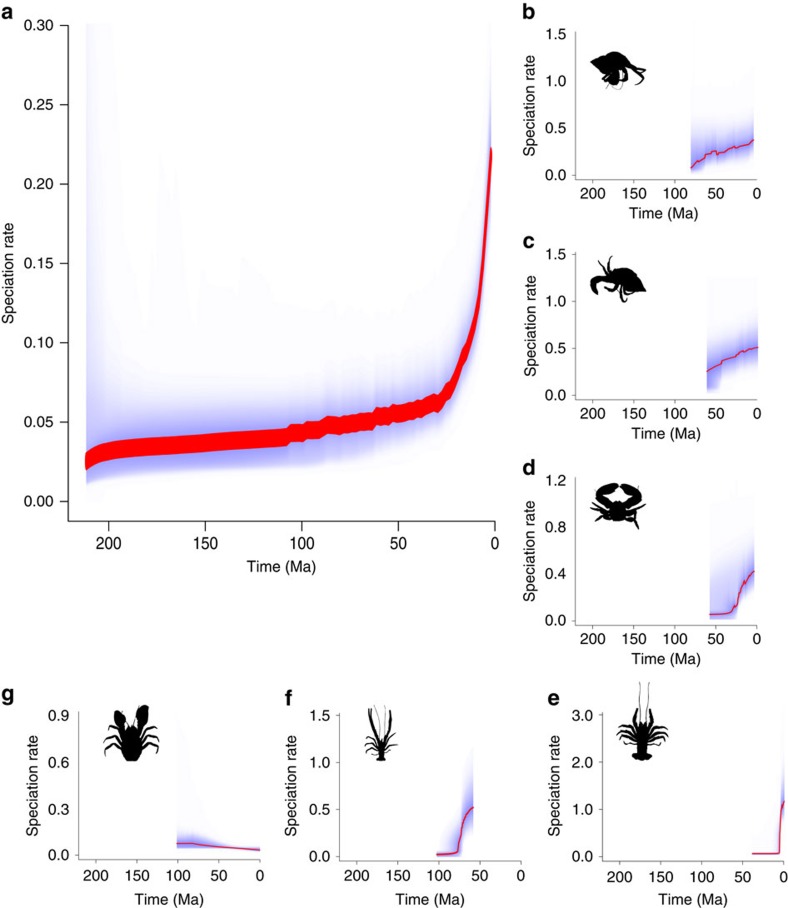
Figure 2. Speciation rates of Anomura and clades.
The large panel (a) shows the speciation rate for the whole tree with the inset histogram showing the distribution for all recorded speciation rate curves for both Pearsons's and DCCA correlation coefficients. The mean correlation for the whole tree is −0.709. Additional panels (b–g) for each of the clades that show a significant diversification rate shift. Clades are (from top right to bottom left): (b) Paguridae+Lithodoidea (clade 2 in Fig. 1), (c) Diogenidae+Coenobitidae (clade 3 in Fig. 1), (d) Porcellanidae (clade 4 in Fig. 1), (e) Paramunida (clade 6 in Fig. 1), (f) Munida (clade 5 in Fig. 1) and (g) Aegloidea (clade 1 in Fig. 1).

