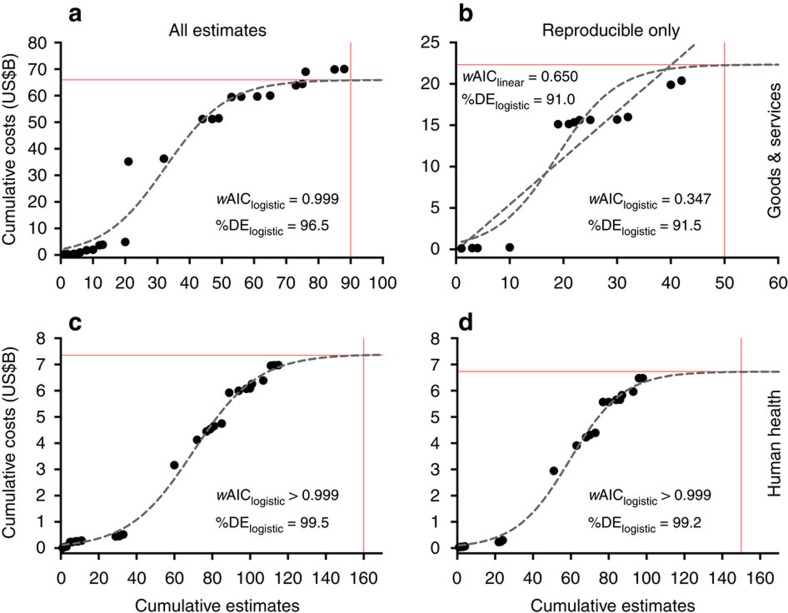
Figure 4. Global cumulative costs due to invasive insects.
Costs are expressed relative to the number of estimates for goods and services (a,b) and human health-related (c,d) costs, and for all estimates (a,c) and reproducible-only estimates (b,d). For a given year t, we summed all values (costs and number of estimates) up to t (see ‘Sampling bias' in the Supplementary Methods for model fitting and comparison methods). We fitted linear, exponential, logarithmic and logistic models to each curve to examine evidence for asymptotic behaviour (identified by the dominance of a logarithmic or logistic model). For all categories except reproducible-only goods and services costs (b), the logistic model (curvilinear grey dashed lines) had the highest Akaike's information criterion (AIC) weights (wAIC≈relative model probability) and explained >96% of the deviance in the data (%DE≈coefficient of determination). For reproducible-only goods and services costs (b), the linear model (straight grey dashed line) had the highest wAIC, indicating that the logistic asymptote was likely an underestimate. For each fit, we also show the approximate asymptotic cost and the associated number of cumulative estimates required to achieve the asymptote (red lines). See also Supplementary Figs 7 and 8 for accumulation curves expressed by region. All costs expressed as 2014 US dollars.

