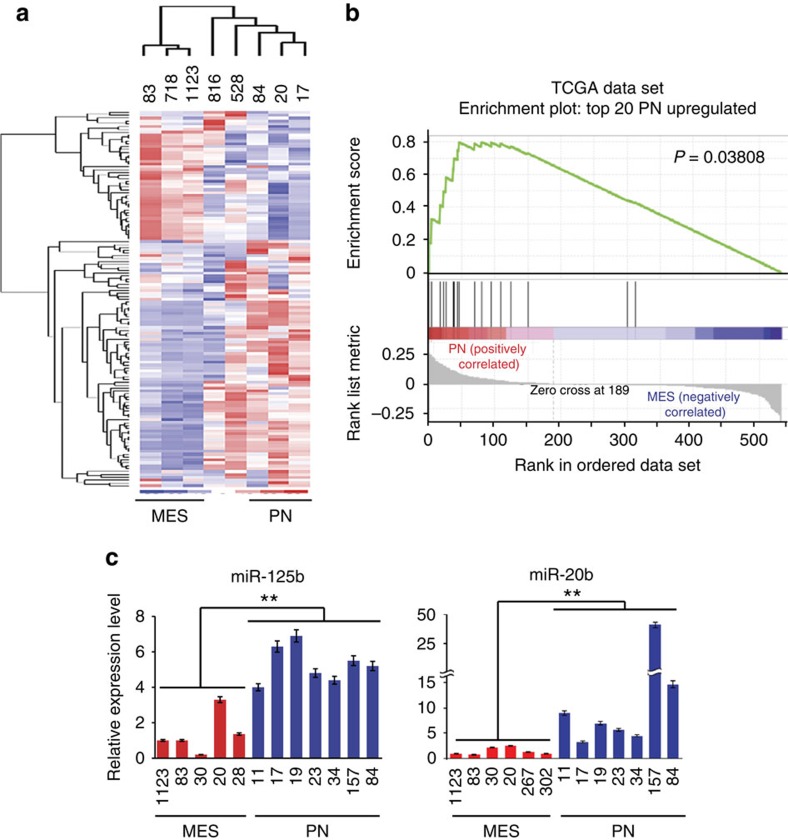
Figure 1. miR profiling and expressions of miR-125b and miR-20b distinguish PN and MES subtypes in GBM.
(a) miRs are differentially expressed in PN 17, 20, and 84, MES 1123, 83, and 528, 718, and 816 glioma spheres. Heat maps were generated from the data of Nanostring nCounter miR Arrays using Cluster 3.0 and Java Treeview 1.1.6. (b) Gene Set Enrichment Analysis (GSEA) was performed for miR expression in TCGA GBM data set. Twenty miRs with top ratios between expression averages of PN and MES glioma spheres displayed enrichment in clinical PN GBM. (c) Relative expression levels of miR-125b and miR-20b of seven PN and five or six MES glioma spheres as indicated were determined with quantitative RT–PCR (qRT–PCR) assays. Error bars (s.d.) represent the data of triplicate samples for each glioma sphere line. **P<0.01, paired two-way Student's t-test. Data are representative from three independent experiments with similar results.

