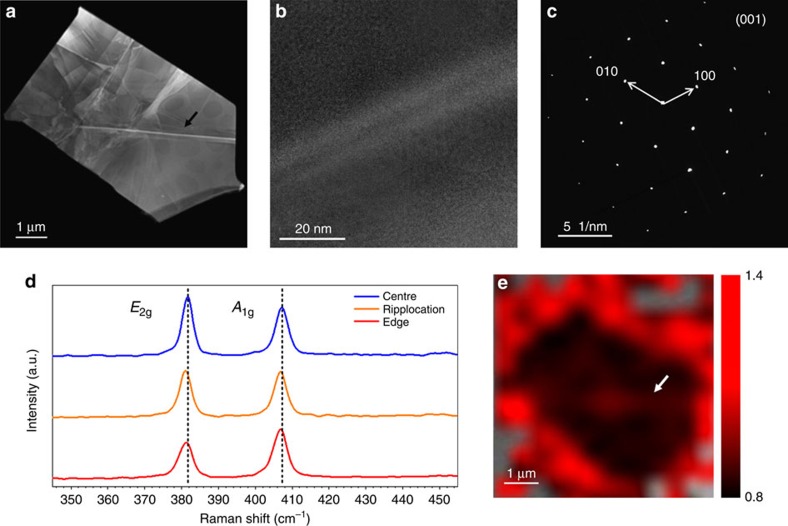
Figure 4. STEM imaging and Raman spectroscopy and imaging of ripplocations.
(a) STEM micrograph of the flake with an estimated size of 5 × 3 μm. (b) High-resolution TEM image of the typical ripplocation. The atomic structure appears unaltered along the defect thus confirming the ‘ripple' nature of the dislocation. (c) Diffraction Pattern of the flake. (d) Raman spectra of a bulk MoS2 flake acquired in the flake centre (blue curve), on the ripplocation (orange curve) and at the flake edge (red curve). (e) A1g/E2g peak intensity ratio map of the flake reported in a, where the region outside the flake are kept transparent (grey). Notice the different ratio between the edge and the central region of the flake. The black and white arrows have been added as guides to the eye in marking a ripplocation in the TEM image and Raman map, respectively.

