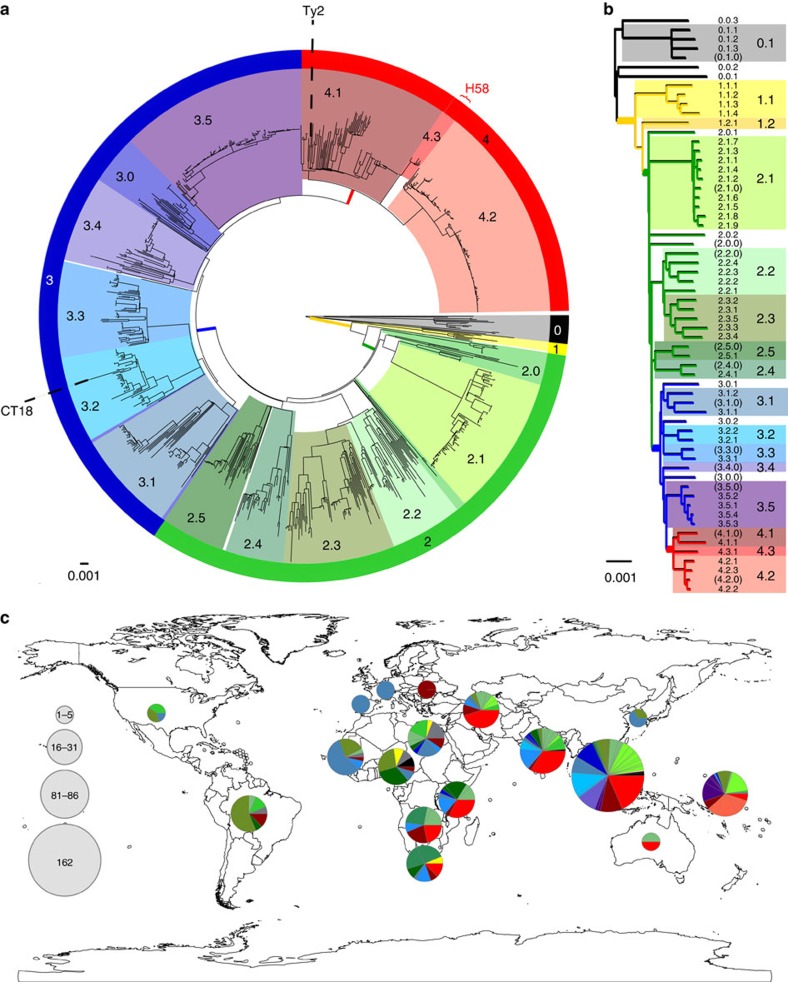
Figure 1. Population structure of S. Typhi based on genome-wide SNPs.
(a) Whole-genome tree of 1,831 global S. Typhi isolates. Primary clusters 1–4 are indicated in the outer coloured ring; branches defining these groups are coloured in the tree. These groups are further divided into clades, which are shaded and labelled. The location of S. Typhi reference genomes CT18 (accession number AL513382) and Ty2 (accession number AE014613) are indicated on the tree. Subclade 4.3.1 (H58, marked in red), which comprises half of the global collection, is represented by just 50 (6%) randomly selected isolates out of the total 852 belonging to this subclade, so that the relationships between other clades can be visualized. (b) Tree backbone showing further division of 16 S. Typhi clades (shaded) into 49 subclades (labelled; note 12 undifferentiated clade groups shown in brackets). Branches are coloured by primary cluster. (c) Map of the world showing subclade diversity of S. Typhi isolates in the global collection, by region22. Where groups of isolates from the same country and year belonged to the same subclade, this was classified as an ‘outbreak' and the group is only represented once in the pie graphs. Pies are sized to indicate number of isolates; slices are coloured by clade; multiple slices of the same colour indicate multiple subclades belonging to the same clade.

