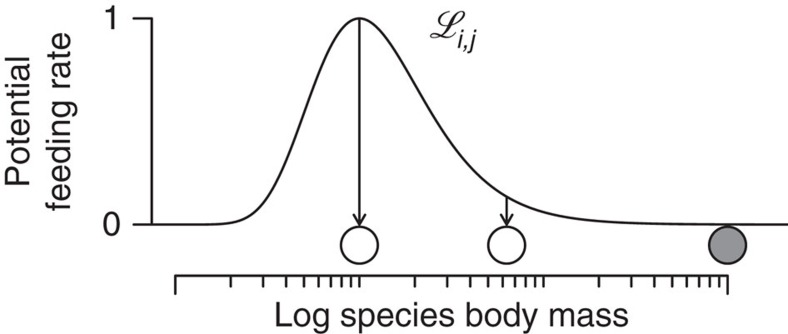
Figure 2. Potential per-capita feeding rate of a consumer species on its resources.
The feeding efficiency,  of a consumer (grey circle) on its resources (white circles), is maximized for an energetically optimal resource size relative to its own body mass. Larger or smaller resource species are consumed less efficiently.

