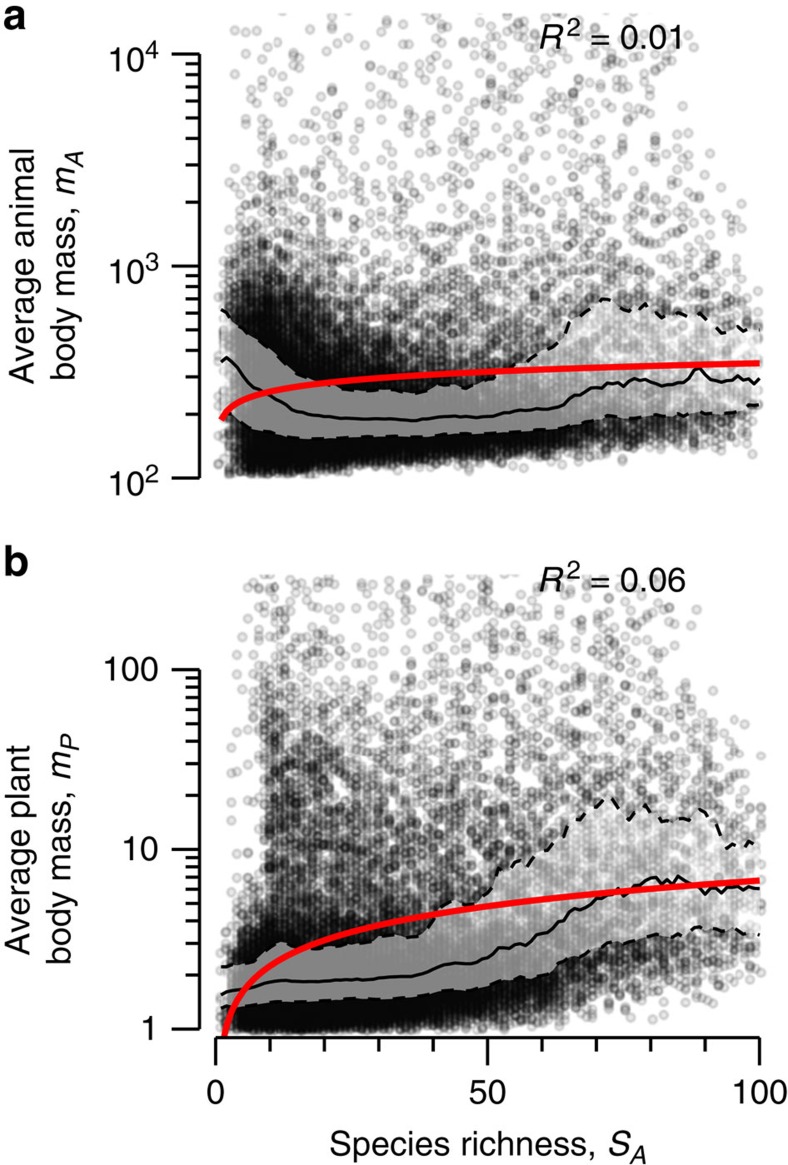
Figure 5. Average individual body mass in response to animal species richness.
Observed average individual body mass of (a) animals and (b) plants. Equations and red lines show fitted power-law models (Methods section); grey line shows median body mass (calculated as median of body mass at each SA±2 with 50%-inner quantile range). Coefficient of determination R2 indicates goodness of fit. The y-axes were truncated to include 95% of simulated food webs.

