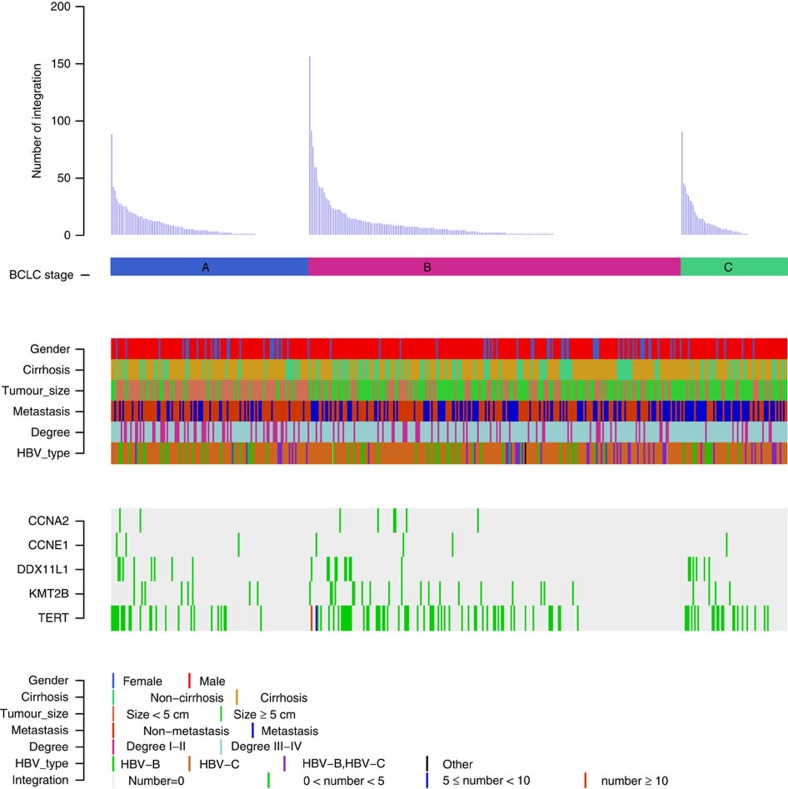
Figure 5. Clinical annotation of HBV integration sites in 426 HCC samples.
All panels are aligned with vertical tracks representing 426 individuals. The data are sorted by BCLC stage, gender, cirrhosis, tumour size, metastasis, Edmonson-Steiner classification and HBV type. The bottom heat map shows the distribution of HBV integrations into the five recurrent HBV targeted genes in HCC samples.

