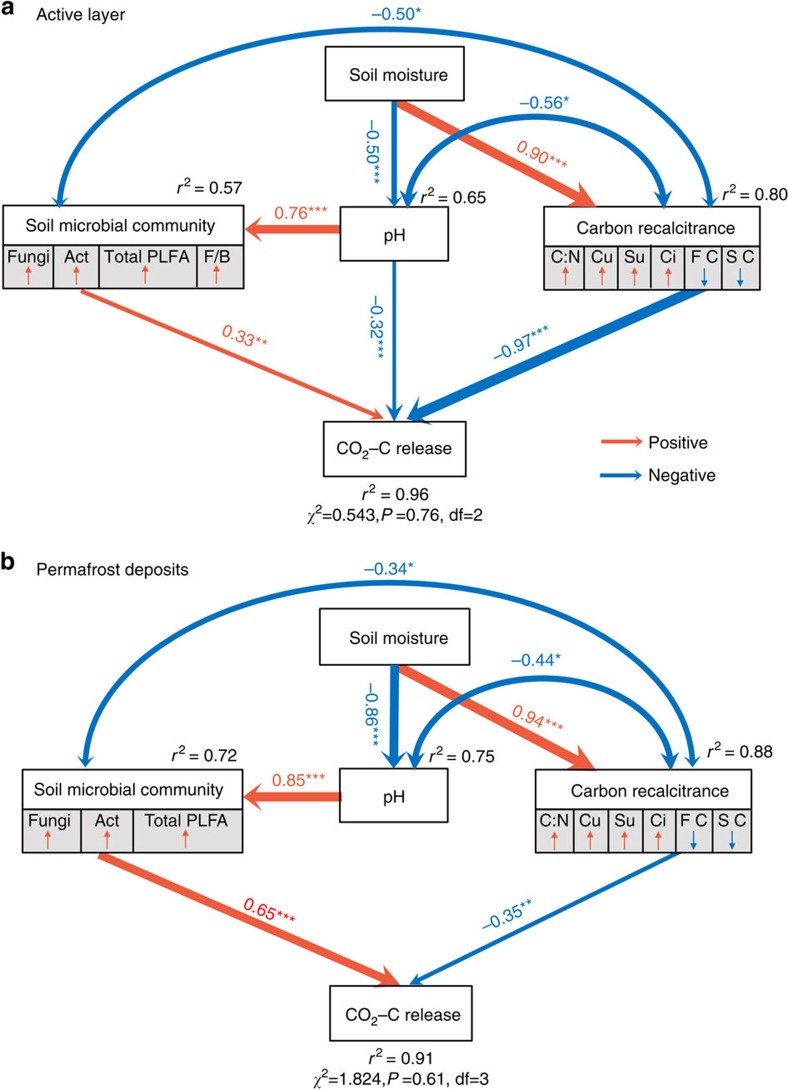
Figure 4. Structure equation modelling (SEM) examining the multivariate effects on CO2–C release.
Effects of soil moisture, pH, microbial community and C recalcitrance on CO2–C release as revealed from SEM for (a) active layer (n=15) and (b) permafrost deposits (n=15). Double-headed arrows represent covariance between related variables. Single-headed arrows indicate the hypothesized direction of causation. Red and blue arrows indicate positive and negative relationships, respectively. Arrow width is proportional to the strength of the relationship. Double-layer rectangles represent the first component from the PCA conducted for soil microbial community and C recalcitrance. Soil microbial community includes total PLFAs, fungal PLFAs (Fungi), actinomycic PLFAs (Act) and fungi/bacteria (F/B) as indicated by PLFA analysis; C recalcitrance includes C:N, cutin-derived components (Cu), suberin-derived components (Su), lignin cinnamyl units (Ci), fast C pool size (FC) and slow C pool size (SC). The soil moisture data used in the SEM were the moisture in the field rather than that during incubation. The red symbol ‘↑' and blue symbol ‘↓' indicate a positive or negative relationship between the variables and the first component from the PCA, respectively. The numbers adjacent to arrows are standardized path coefficients, which reflect the effect size of the relationship. The proportion of variance explained (r2) appears alongside each response variables in the model. Goodness-of-fit statistics for the model are shown below the model. *P<0.05, **P<0.01, ***P<0.001.

