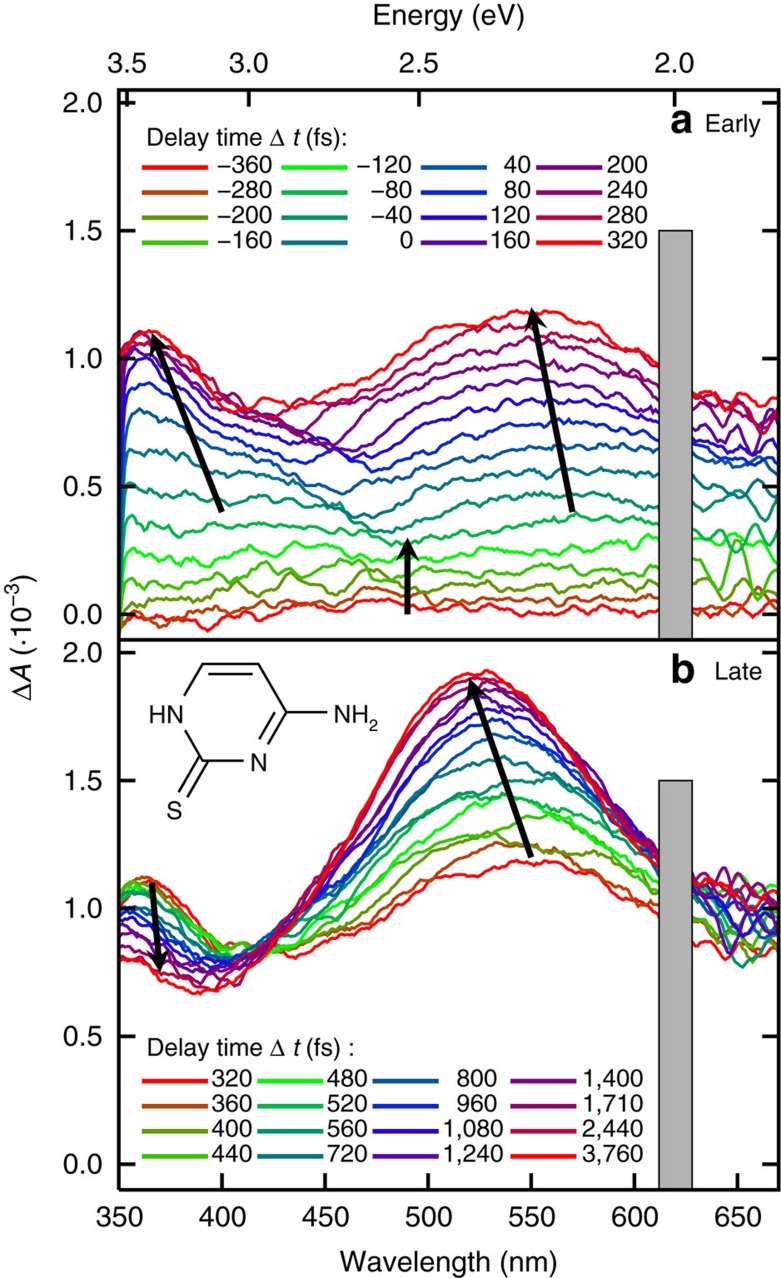
Figure 1. Transient absorption spectra.
(a) Early time delays (−360 to 320 fs) and (b) later time delays (320 to 3,760 fs). The spectra were recorded in phosphate buffer solution (pH 7.4) using an excitation wavelength of 308 nm. Arrows indicate the movement of the absorption bands with time. The grey boxes block the overtone band of the excitation light. The inset shows the molecular structure of 2-thiocytosine.

