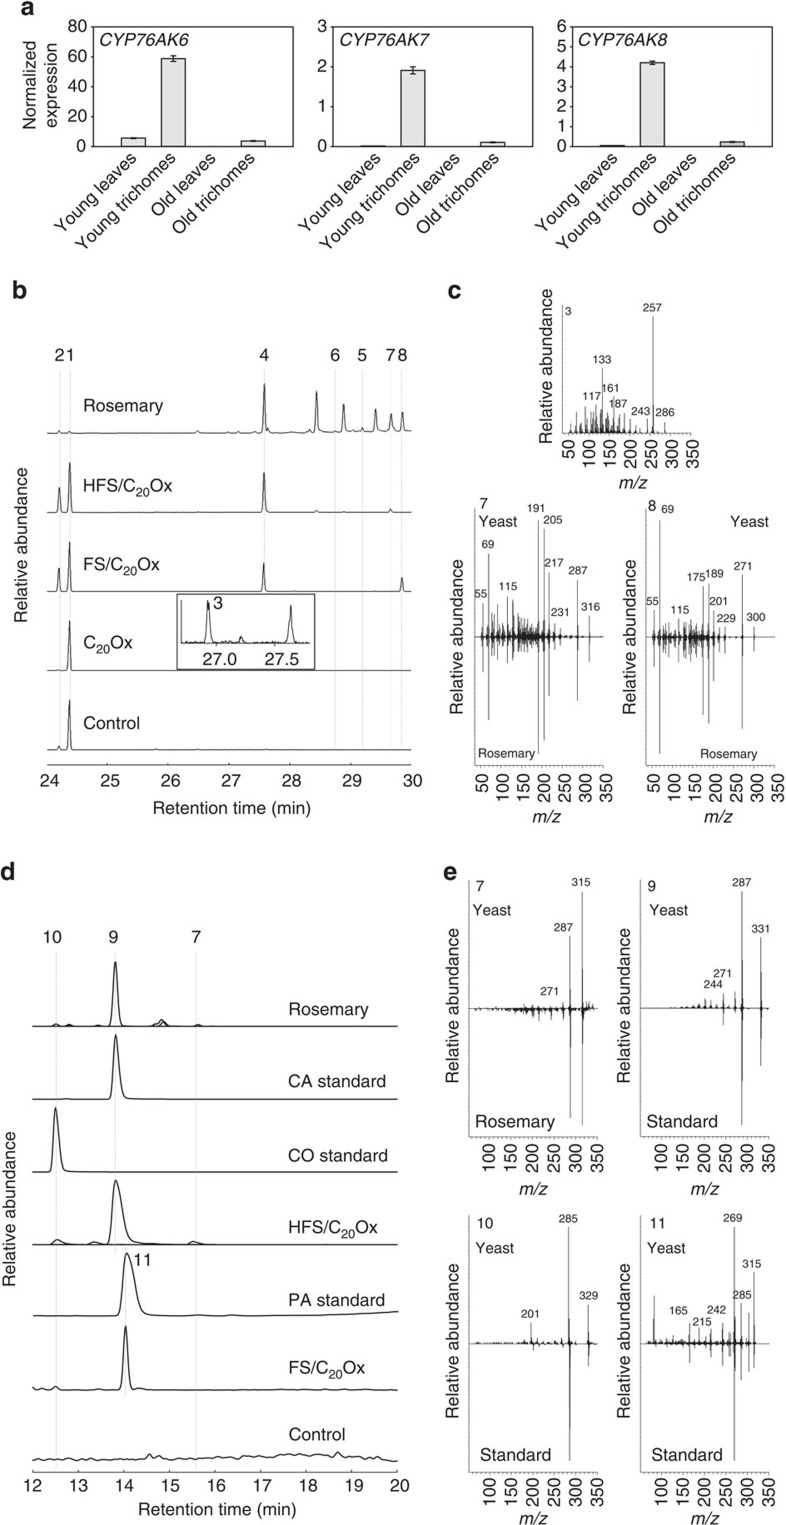
Figure 3. Functional analysis of C20Ox.
(a) Expression profile of CYP76AK6-8 in young and old trichomes and leaves without trichomes. CYP76AK6 is from S. fruticosa, CYP76AK7-8 are from R. officinalis. Quantitative reverse transcriptase–PCR data were obtained from three technical replicates and normalized to the eukaryotic elongation factor 4a. (b) GC–MS analysis (selected m/z signals: 270, 272, 286, 300, 302 and 316) of extracts from rosemary leaf surfaces or from yeast strains co-expressing GGPPS, CPS, MS, ATR1, CYP76AH22 (HFS) and CYP76AK6 (C20Ox). The labelled peaks correspond to miltiradiene (1), abietatriene (2), ferruginol (4), 11-hydroxyferruginol (5), hydroxyferruginol quinone (6), carnosaldehyde (7) and pisiferal (8). The framed chromatogram is part of the GC–MS analysis (selected m/z signal: 286) of yeast expressing GGPPS, CPS, MS, ATR1 and C20Ox. The peak labelled (3) corresponds to miltiradien-20-al. (c) Electron impact mass spectra of PDs from yeast or rosemary. The spectra were isolated from yeast strains expressing GGPPS, CPS, MS, ATR1 and CYP76AK6 for miltiradien-20-al (3); GGPPS, CPS, MS, ATR1, CYP76AH22 and CYP76AK6 for carnosaldehyde (7); and GGPPS; CPS, MS, ATR1, CYP76AH1 and CYP76AK6 for pisiferal (8). (d) LC–MS analysis (selected m/z signals: 301.217, 315.196, 331.191 and 329.175) of rosemary extract, authentic standards and yeast extracts from strains expressing GGPPS, CPS, MS, ATR1 CYP76AH22 (HFS) and CYP76AK6 (C20Ox). Carnosaldehyde (7), CA (9), CO (10) and PA (11). (e) ESI mass spectra of PDs from yeast (expressing GGPPS, CPS, MS, ATR1, CYP76AH22 and CYP76AK6 for carnosaldehyde (7); GGPPS, CPS, MS, ATR1, CYP76AH22 and CYP76AK6 for CA (9) and CO (10); and GGPPS, CPS, MS, ATR1, CYP76AH1 and CYP76AK6 for PA (11) or rosemary and authentic standards.

