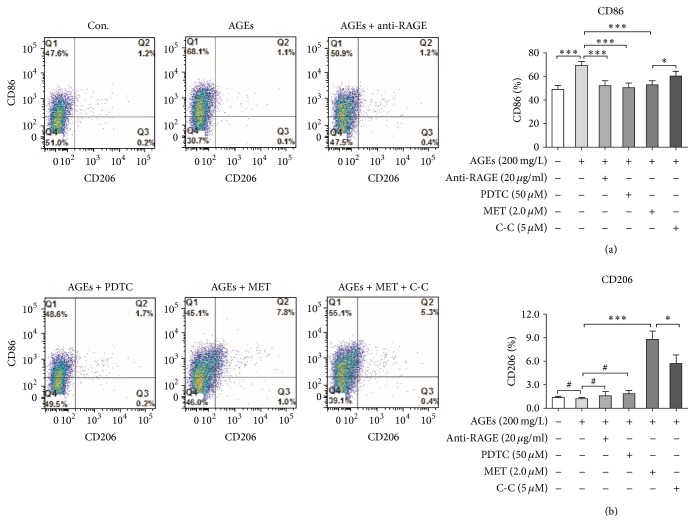
Figure 6.
Metformin changes AGEs-induced surface markers expression on macrophages. BMDMs were divided into 6 groups: control, AGEs, AGEs + anti-RAGE, AGEs + PDTC, AGEs + MET, and AGEs + MET + C-C. In AGEs group, cells were cultured with AGEs at 200 mg/L for 24 h; in AGEs + anti-RAGE group, cells were pretreated with anti-RAGE neutralizing antibodies for 60 min followed by AGEs at 200 mg/L for 24 h; in AGEs + PDTC group, cells were pretreated with PDTC for 60 min followed by AGEs at 200 mg/L for 24 h; in AGEs + MET group, cells were pretreated with metformin at 2.0 μM for 60 min and then cultured with AGEs at 200 mg/L for 24 h; in AGEs + MET + C-C group, cells were pretreated with Compound C at 5 μM for 60 min, and then they were treated with metformin at 2.0 μM for 60 min followed by AGEs at 200 mg/L for 24 h; in control group, cells were cultured with BSA at 200 mg/L for the same amount of time. Single cell suspensions then were prepared. M1 surface marker CD86 and M2 surface marker CD206 were detected by flow cytometry analysis. Bar graphs represent the results (mean ± SD) of five independent experiments. One-way ANOVA was applied and all the overall ANOVA was significant. # p > 0.05; ∗ p < 0.05; and ∗∗∗ p < 0.001 when compared between selected groups.

