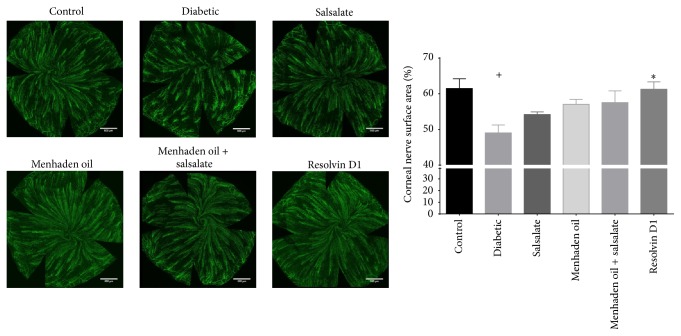
Figure 3.
Immunohistochemical analysis of subepithelial corneal nerves using neuronal class β-III tubulin. A maximum intensity projection image was acquired as described in the Materials and Methods. Corneal nerve surface area was determined using Imaris software and the effects of treatment can be seen in the graph. Data are presented as mean percentage of nerve coverage ± SEM relative to the area of the entire cornea. The number of animals per group was the same as described in Table 3. + p < 0.05 compared to control group. ∗ p < 0.05 compared to untreated diabetic group.

