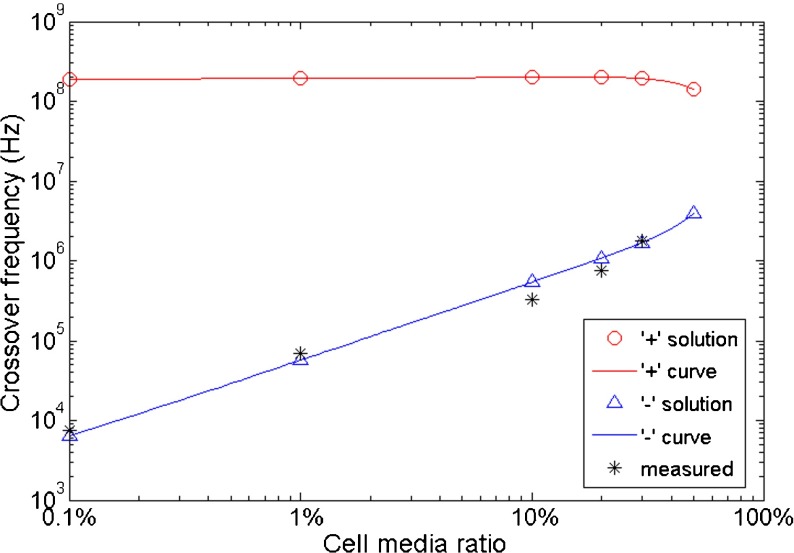
Fig. 3.
Comparison of theoretical CFs calculated with a ‘+’ sign (red) and a ‘–’ sign (blue) from expression (7). Black data points represent the measured CFs (stars). The property values of hippocampal neurons used in this calculation are: ɛ c/ɛ 0 = 60, σ c = 0.7 Sm−1, c m = 0.010 Fm−2, r = 4.3 μm

