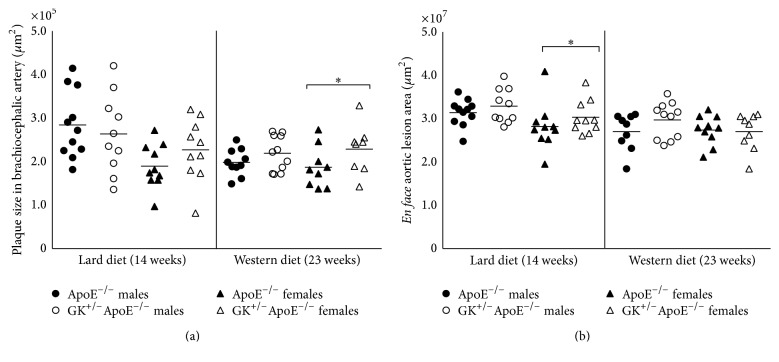
Figure 5.
Histology evaluation of plaque size in the brachiocephalic artery (a) and en face lesion area in the thoracic aorta (b) measured in the atheroprogression study. There is a trend for GK+/−ApoE−/− mice to have greater plaque compared with the ApoE−/−, with female GK+/−ApoE−/− having a more consistent pattern. Statistical analysis was performed using t-test and a p value of less than 0.05 was considered significant. ∗ p < 0.05.

