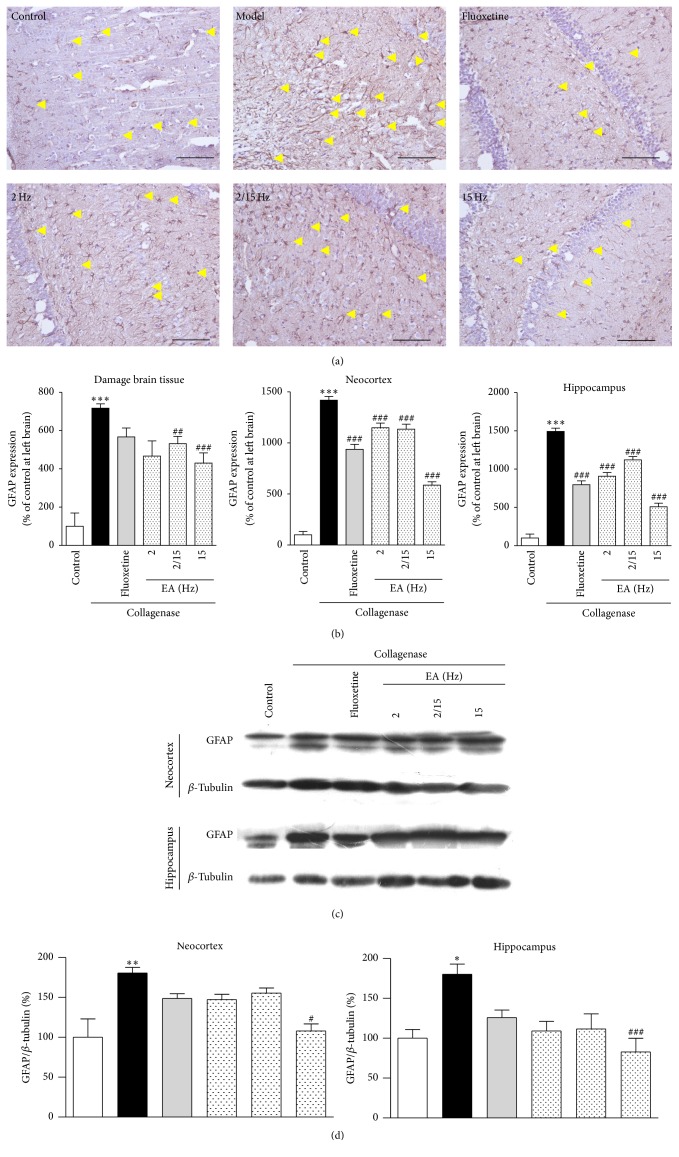
Figure 3.
Effects of the different frequency EA treatments on GFAP expression in the brains of the CPSP rats. (a) Representative photomicrographs of immunohistochemical staining of GFAP expression in the brains of the CPSP rats that had been treated with or without EA on the 5th day after the operation. The yellow arrows denote glia cells. (b) Determination of GFAP expression in the brains of the CPSP rats using a multispectral analysis (ipsilateral brain section). (c) Representative Western blots of ipsilateral GFAP expression in the neocortex and hippocampus of the CPSP rats. (d) Western blot determination of (c). ∗, ∗∗, and ∗∗∗ denote p < 0.05, 0.01, and 0.001 versus the control; #, ##, and ### denote p < 0.05, 0.01, and 0.001 versus the model (n = 5 in each group; one-way analysis of variance, followed by the Newman-Keuls post hoc test), respectively.

