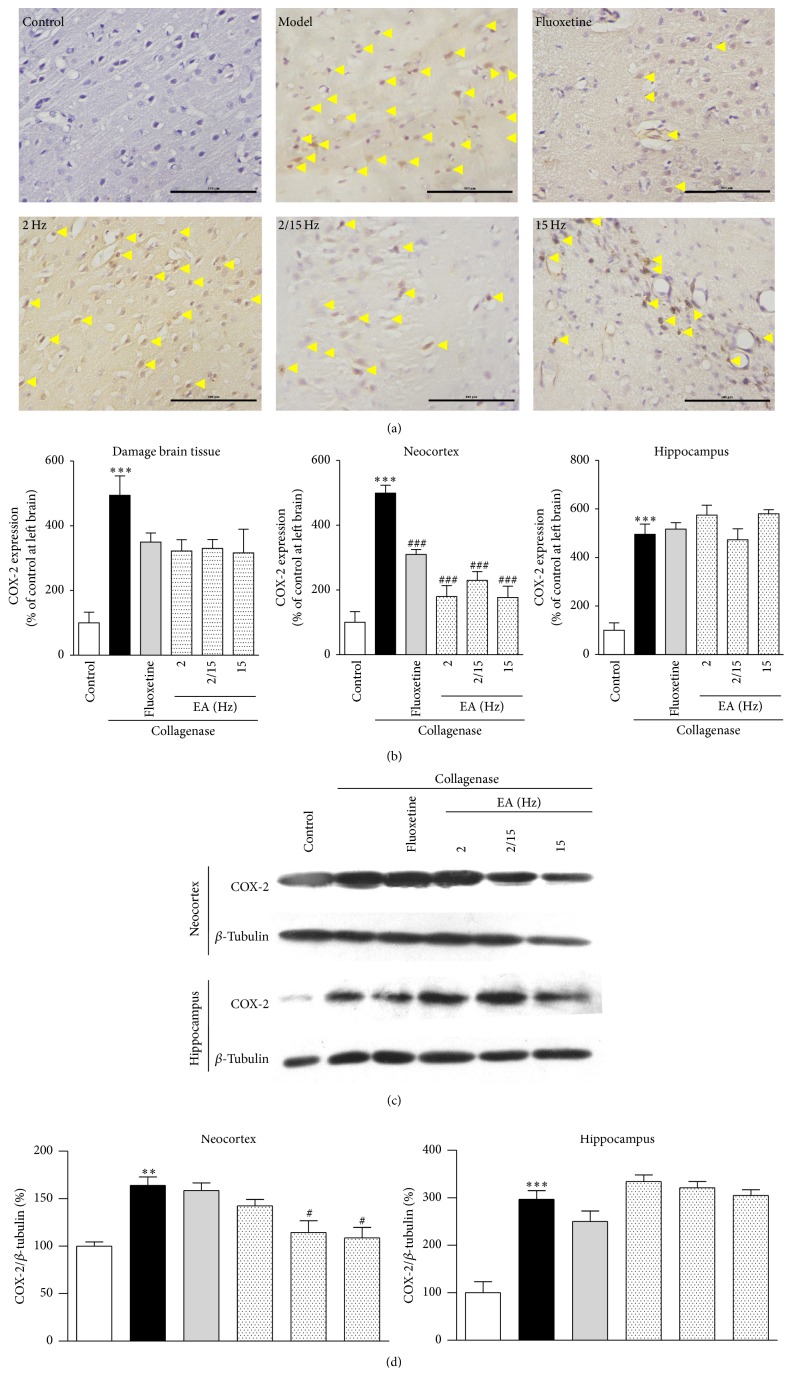
Figure 4.
Effects of the different frequency EA treatments on COX-2 expression in the brains of the CPSP rats. (a) Representative photomicrographs of immunohistochemical staining of COX-2 expression in the brains of the CPSP rats that had been treated with or without EA on the 5th day after the operation. (b) Determination of COX-2 expression in the brains of the CPSP rats using a multispectral analysis (ipsilateral brain section). (c) Representative Western blots of COX-2 expression in the ipsilateral neocortex and hippocampus of the CPSP rats. (d) Western blot determination of (c). ∗∗ and ∗∗∗ denote p < 0.01, 0.001 versus the control; # and ### denote p < 0.05, 0.001 versus the model (n = 5 in each group; one-way analysis of variance, followed by the Newman-Keuls post hoc test).

