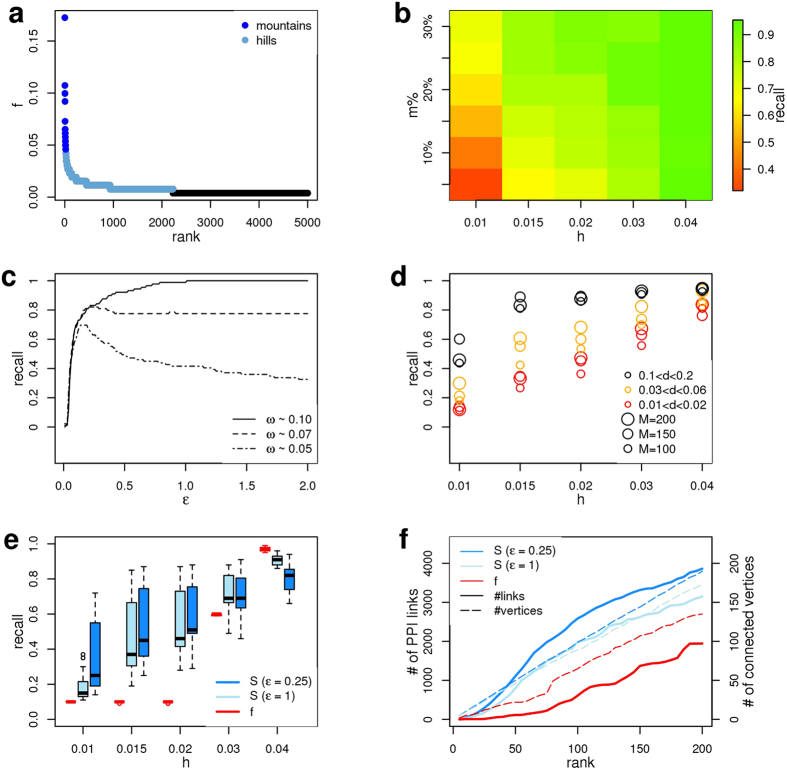
Figure 2. Performance of differential network smoothing index in simulated datasets containing gene modules enriched in omics information.
(a) Somatic gene mutation relative frequencies ranked in decreasing order to underline mountains and hills. (b) Heatmap of recall values with varying percentage of mountain genes m% and average hill frequency h, calculated on a sample of modules of size M = 100. (c) Fraction of recalled genes for different values of parameter ε with varying ω. (d) Average recall obtained on several toy datasets of different sizes M = {100, 150, 200} and topological density d, for different values of h. (e) Comparison between recall values obtained ranking genes by S or f, for different values of ω, on several toy datasets. (f) Number of links and number of connected genes among the top ranking genes ranked by f or S. (a–f) Simulations were run using STRING PPIs. (c–f) The signal ω was computed with m% = 0.1.

