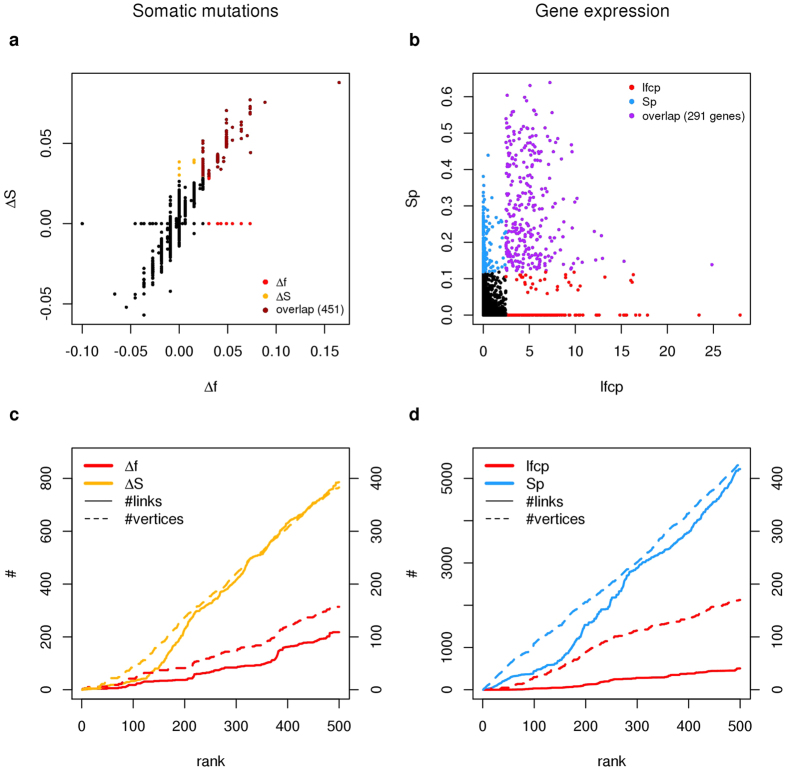
Figure 4. Comparison of network-based and network-free quantities calculated on somatic mutation and gene expression data from PRAD samples associated with two different prognostic groups.
(a,b) Scatter plot with network-based (y–axis) vs network-free (x–axis) gene scores calculated on PRAD SM (a) and GE (b) data; colours indicate the top 500 genes ranked by network-free (red) or network-based (yellow, blue) scores and the overlaps (brown, purple). (c,d) Number of links (y–axis, left) and number of connected genes (y–axis, right) within the first 500 genes ordered by network-based (ΔS, Sp) and network-free (Δf, lfcp) gene scores, calculated on PRAD SM (c) and PRAD GE (d) data. (a–d) ΔS and Sp were calculated using STRING PPIs and, respectively, ε = 0.25 and ε = 1. (c,d) #Number of links (vertical axis, left) or number of veritces (vertical axis, right).

