
Figure 5. mRNA expression levels of significantly affected apolipoproteins sequenced from control (+1C) and low 1-C (−1C) F1 embryos.
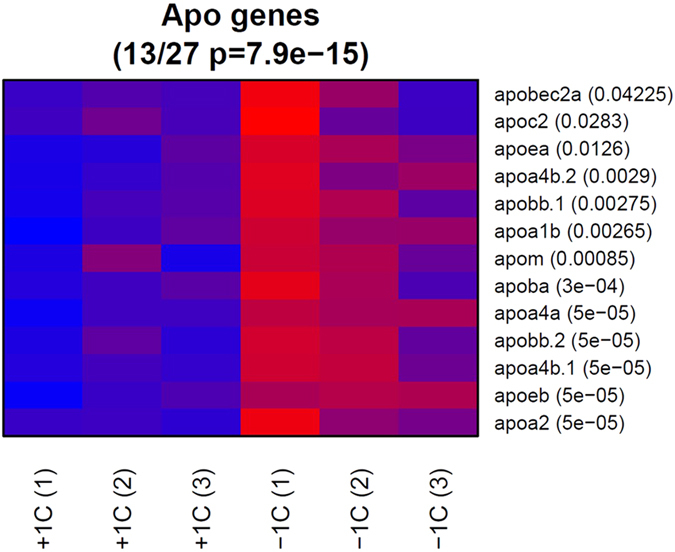
The low 1-C F1 embryos have significantly higher expression levels than control embryos. Expression levels are indicated by colour codes, with blue to red indicating min to max expression level for each gene, respectively. P-values are indicated next to the gene names.