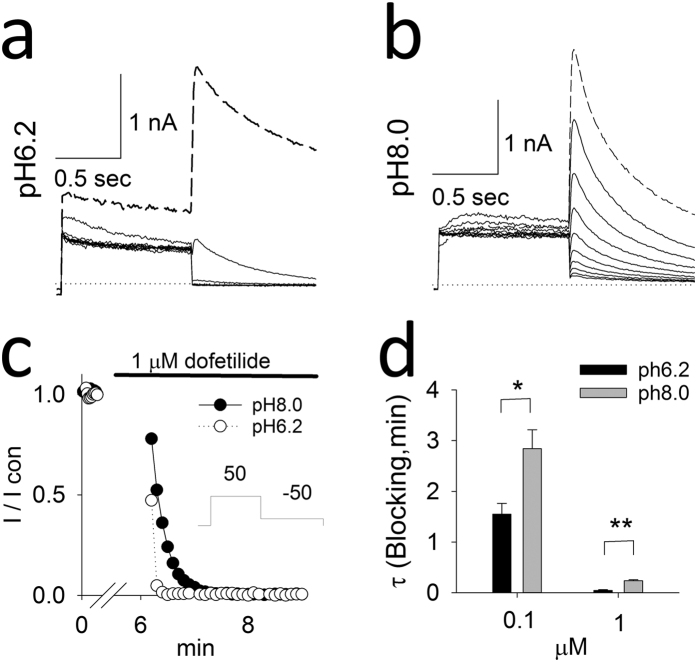
Figure 6.
Time-course of onset of use-dependent block (a,b). The superimposed hERG current traces before (dashed line at baseline) and for each pulse of use dependent block with 1 μM dofetilide (solid lines) in different intracellular pHs. (c) The time courses of cells of A and B. The insert showed the experiment protocol. (d) Decay time constants at 0.1 and 1 μM dofetilide in different intracellular pHs. Single exponential function was used to fit the decay time courses. N = 5, 4 in 0.1 μM and 1 μM dofetilide at pH of 6.2, 8.0.

