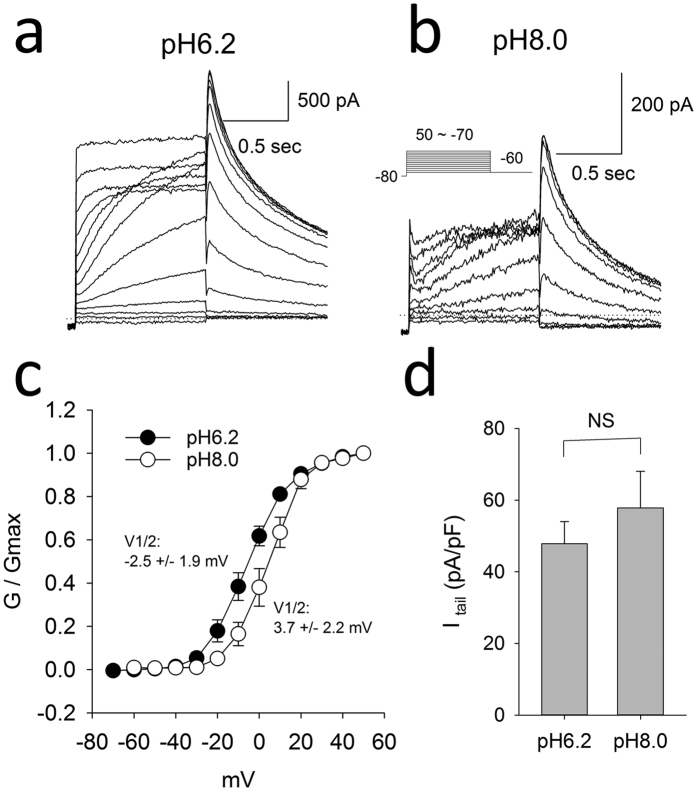
Figure 7.
Raw example hERG current traces recorded in the drug-free state at intracellular pH of 6.2 (a) and 8.0 (b) elicited by the pulse protocol shown in the insert. (c) Average g-V relationship of hERG currents at intracellular pH 6.2 versus 8.0. The average V1/2 were −2.5 +/− 1.9 mV in pH 6.2 n = 5 and 3.7 +/− 2.2 mV at pH 8.0 (n = 4, P < 0.05, t test). The slope factor were 9.2 +/− 0.4 and 8.2 +/− 0.3 respectively. (d) Average current density amplitudes at pH6.2 and pH8.0 (n = 9, 11).

