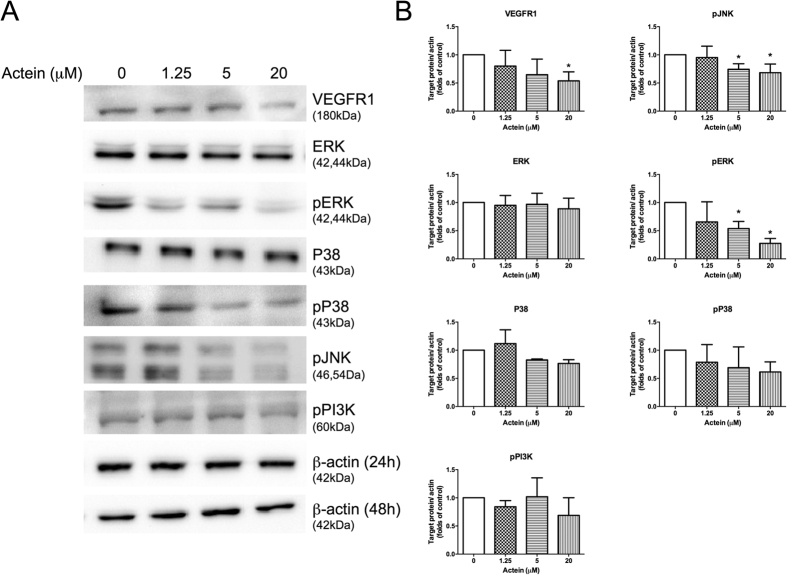
Figure 2. Effects of actein on expressions of VEGFR1 and signaling kinases in HMEC-1 cells.
Western blot analyses on P38, pP38, ERK, pERK, pJNK, pPI3K expressions in actein-treated HMEC-1 cells for 24 hours (or 48 hours for VEGFR1) were performed. (A) Immunoblotting was performed 3 times using independently prepared cell lysates and the representative blots were shown. (B) The histograms showed the quantified results of protein levels, which were adjusted with corresponding β-actin protein levels and expressed as fold of control (mean fold of control + SD from 3 independent experiments). Differences among the treated and vehicle-treated control groups were determined by one-way ANOVA with Tukey’s post-hoc test. *p < 0.05 as compared to control group.

