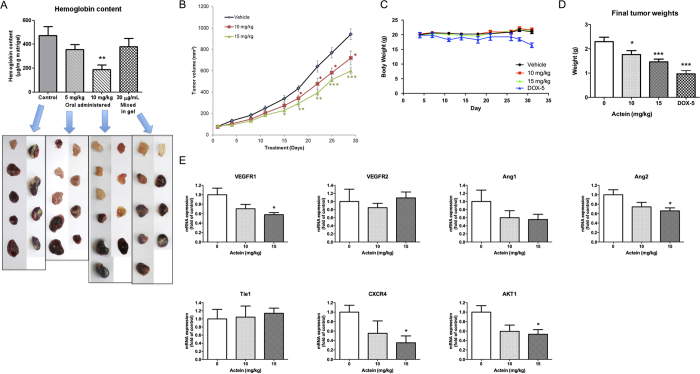
Figure 3. Effects of actein on angiogenesis and tumor growth in mouse models.
(A) Upper: Hemoglobin content of matrigel plugs from different treatment groups (n = 9-10). Lower: The photos of matrigel plugs excised from mice of different treatment groups 7 days after inoculation. (B–E) 4T1 tumor-bearing mice were treated with actein (10 or 15 mg/kg) or vehicle for 4 weeks. The volumes of tumors (B) and body weights (C) were recorded and expressed as mean ± SEM (n = 12). (D) The final tumor weights after actein or vehicle treatments. (E) Quantitative RT-PCR analyses of VEGFRs, Ang1, Ang2, Tie1, CXCR4, AKT mRNA expressions in tumors excised from different treatment groups. Tumor tissues were collected for RNA extraction. Data were normalized to corresponding human beta-2 microglobulin (B2M) expressions in tumors of vehicle-treated group. mRNA expressions results are expressed as fold of control (mean fold of control + SEM from 8 mice each group). Differences among the treated and vehicle-treated control groups were determined by one-way ANOVA with Tukey’s post-hoc test. *p < 0.05, **p < 0.01, ***p < 0.001 as compared to control group.

