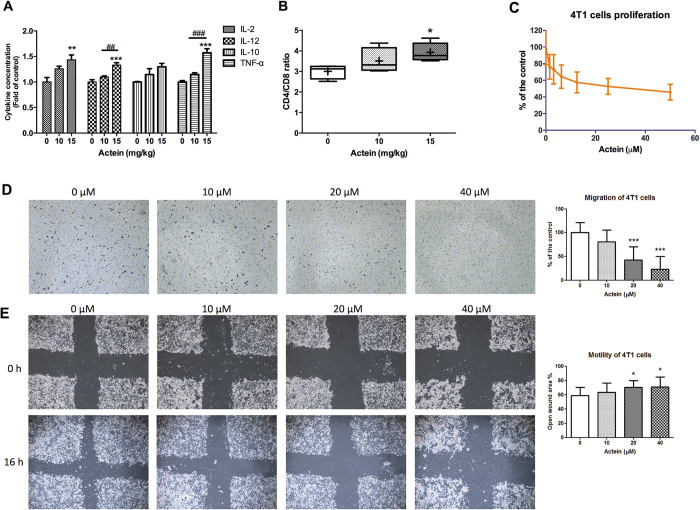
Figure 5. Effects of actein on cytokine profiles and T-lymphocyte subset distribution of tumor-bearing mice and on 4T1 cell proliferation and migration.
Spleens of tumor-bearing mice were excised for lymphocyte isolation as described in methodology section. Lymphocytes were incubated for 24 hours and the culture supernatants were collected. Cytokines concentrations of (A) IL-2, IL-10, IL-12, TNF-α were specifically determined by ELISA. Results were expressed as fold of control (mean fold of control + SEM from 6 mice each group). Another portion of spleen lymphocytes were with T-lymphocyte subset antibody cocktail and the number of stained cells for CD3, CD4 and CD8 were quantified by fluorescence activated cell sorting and were depicted here as the ratio of CD4+ and CD8+ cells per 20,000 viable cells. (B) Results were expressed in box and whisker plots of 6 mice each group. (C) 4T1 cells were treated with different concentrations of actein for 48 hours, then cell proliferation was determined by [methyl-3H] thymidine incorporation assays. Results are expressed as the mean % count per minute in treated and vehicle-treated control wells (mean ± SD of 3 independent experiments with 5 wells each). (D) Representative photomicrographs showing the migrated and stained 4T1 cells on the lower side of membranes in the presence or absence of actein. Quantification of cell migration in modified Boyden chambers was shown. Results are expressed in number of cells per field (mean + SD of 4 independent experiments). (E) Representative photomicrographs showing the cells migrated across the scratch wound in the presence or absence of actein after 16 hours of incubation. Quantification of wound-induced cell motility in 4T1 was shown. Results are expressed as the mean open wound area (mean + SD of 3 independent experiments). Differences among the treated and vehicle-treated control groups were determined by one-way ANOVA with Tukey’s post-hoc test. **p < 0.01, ***p < 0.001 as compared to control group. *p < 0.05, **p < 0.01, ***p < 0.001 as compared to control group. ##p < 0.01, ###p < 0.001 as compared among groups.

