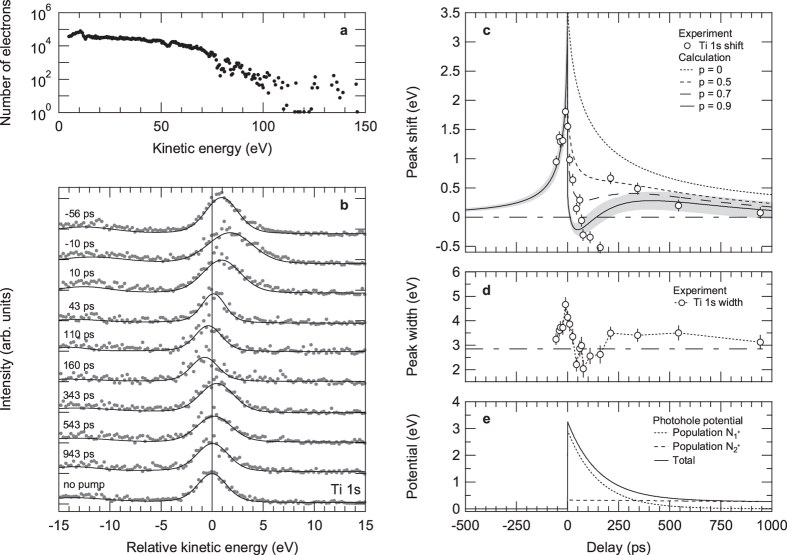
Figure 6. Tracking pump laser-induced dynamics in La:SrTiO3.
(a) Low-energy photoemission spectrum of La:SrTiO3 for a pump fluence of 30 mJcm−2. The photoemission intensity is normalized to the total number of photoelectrons. (b) Evolution of selected Ti 1 s core-level photoemission spectra of La:SrTiO3 as a function of pump-probe delay at a pump fluence of 30 mJcm−2 (hν ≈ 8 keV). The vertical line marks the peak position for a blocked pump beam (E0 = 3026.31 eV). The maximum pump laser-induced shift towards higher kinetic energies is observed at time zero when pump and probe pulses overlap in time. (c) Spectral shift of the Ti 1 s emission as a function of pump-probe delay. The open circles are experimental data; the lines are from an analytical model considering different fractions of stationary photoholes p inside the sample. Gray shadings represent the error bars of the calculation assuming a charge fraction of p = 0.9. (d) Measured Gaussian width of the Ti 1 s emission as a function of pump-probe delay. The dashed horizontal line marks the peak width for a blocked pump beam. (e) Photohole recombination dynamics inside the sample extracted from the mean-field calculations (p = 0.9 photoholes per pump electron included). The photohole population ( ) as well as the related electrostatic potential are assumed to decay bi-exponentially as a function of time with time constants τ1 = 150 ps and τ2 = 5 ns.

