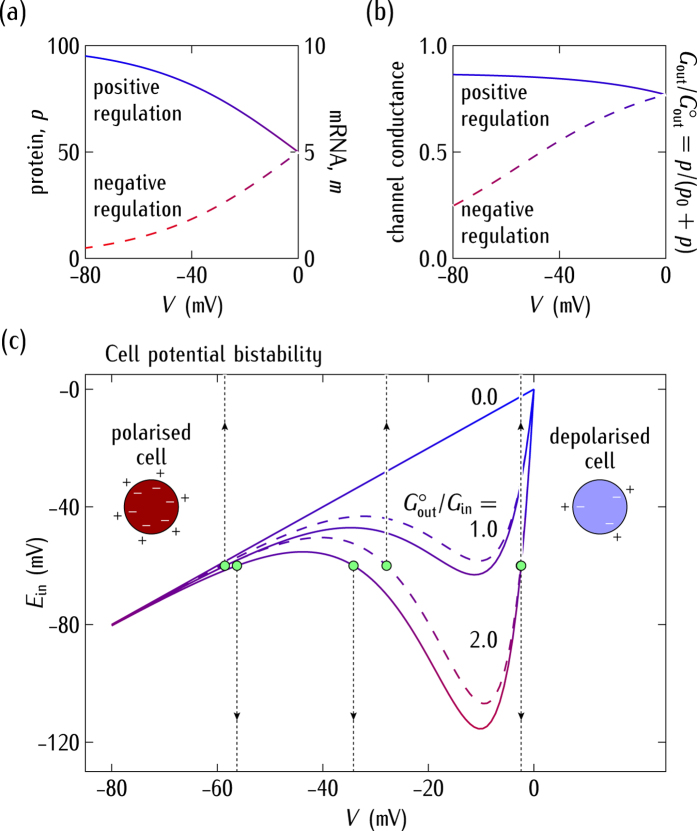
Figure 2.
(a) The steady-state relative concentrations of mRNA (m) and protein (p) as a function of V. (b) The normalised outward conductance  resulting from the values of p as a function of V. (c) The cell potential V obtained by solving the bioelectrical equation of Fig. 1 as a function of the equilibrium potential Ein parametrically in the outward to inward conductance ratio
  . The cases of positive (continuous curves) and negative (dashed curves) regulation are considered. For particular values of Ein and
  , the cell potential enters into a bistability region where three (polarised, unstable, and depolarised) values for V are possible. The vertical arrows show these potentials for the reference case
  considered here.

