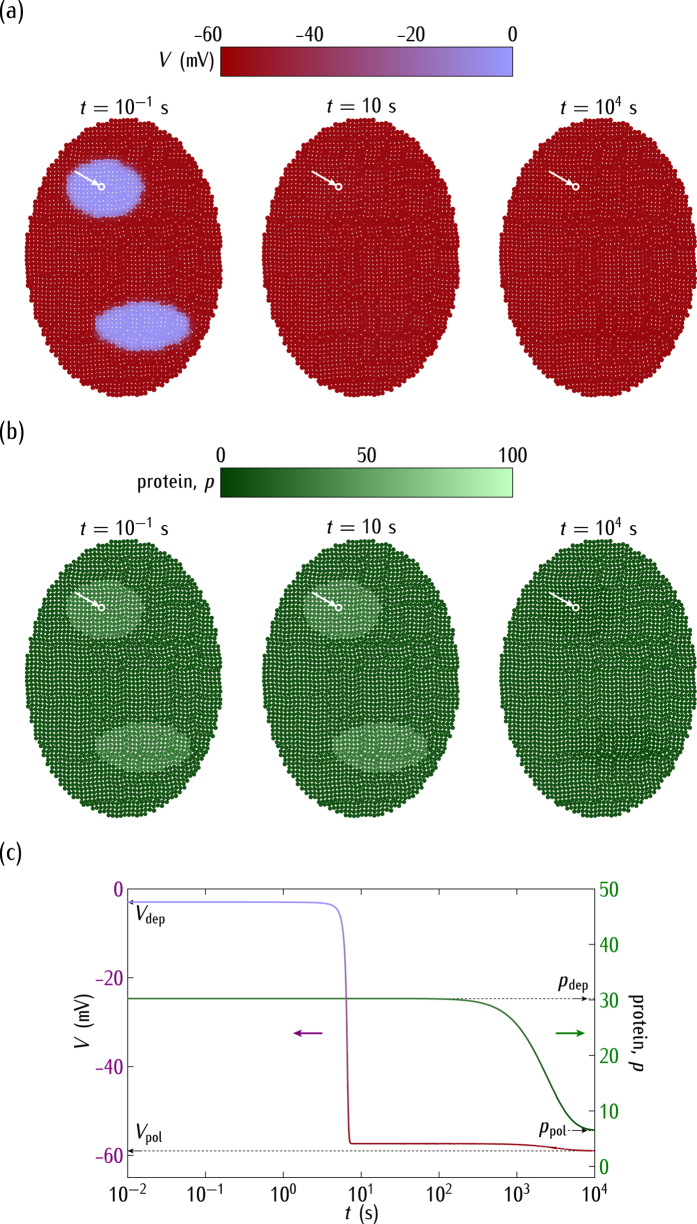
Figure 5.
(a) The cell potential spatial regionalisation. (b) The protein regionalisation. (c) The time relaxations of V and p for the central cell marked by the arrow. We consider now the case of the negative regulation in Fig. 1. As in Fig. 4, the cell potentials are initially depolarised (V = −3 mV) at the two predefined regions where  and polarised (−59 mV) in the rest of the system characterised by the reference rate constants
  of Fig. 2. Because of the negative regulation, the electrical relaxation gives a polarised ensemble (short times) while the genetic relaxation gives low protein concentrations (long times).

