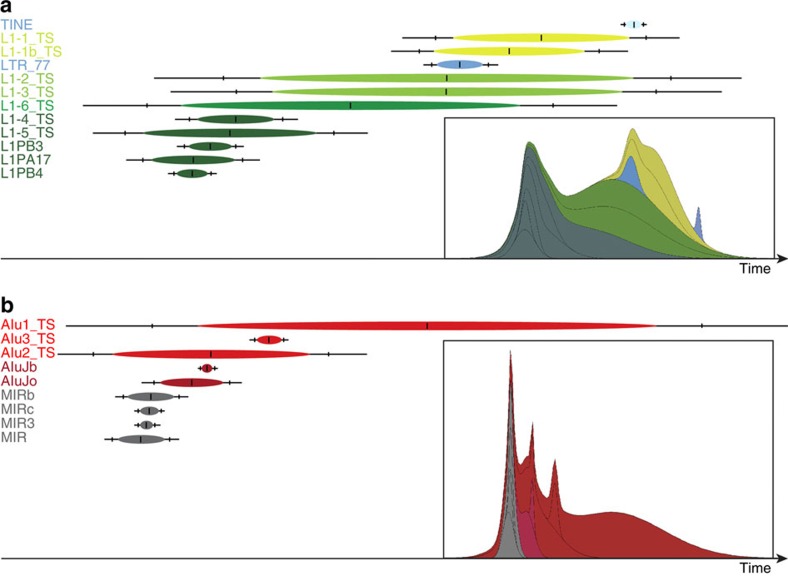
Figure 2. Transposition in transposition (TinT) patterns of TINEs and SINEs over time.
(a) Old LINE (L1) elements are displayed in dark green, younger L1s in light green. The TINEs and their proposed LTR_77_TS source gene are depicted in blue. The period of maximal activity is indicated as a central vertical line within the coloured ovals. The flanking vertical lines represent the 75th percentile of the activity range; the terminal lines show the 99th percentile range of activity. The timescale runs from left to right. (b) Transposition in Transposition (TinT) pattern of SINE elements, including mammalian-wide interspersed repeats (MIRs; grey), the primate-specific AluJb and AluJo (dark red), and the tarsier-specific Alu1-3_TS elements (red). The period of maximal activity is indicated as a central vertical line in the coloured ovals. The flanking vertical lines represent the activity within the 75th percentile range; the terminal lines represent the 99th percentile intervals. The corresponding cumulative likelihoods of element family activity are given as thumbnails in the insets.

