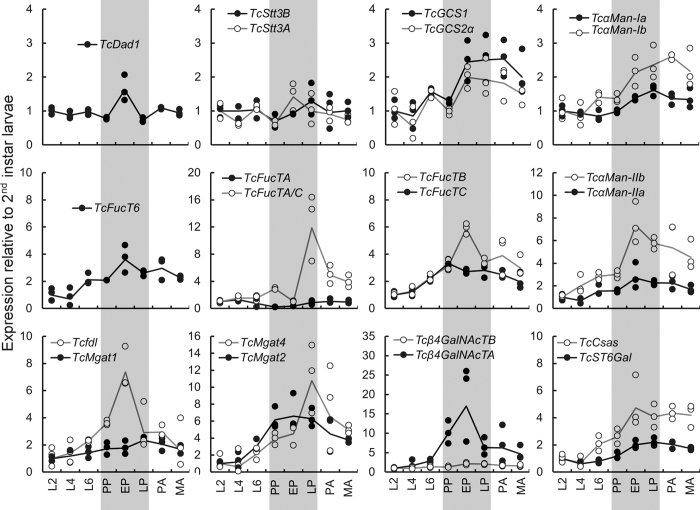
Figure 3. Expression of genes involved in N-glycosylation pathway changes during post-embryonic development.
L2, L4, L6 – 2nd, 4th, 6th instar larvae; PP, EP, LP – pre-, early, late pupa; PA, MA – pharate, mature adults. Relative gene expression was quantified with qRT-PCR using TcRpL32 and TcRpS6 as reference genes and normalized to L2 expression level. All data points are shown (n = 3). Lines connect the average values. Note the highest expression of most genes during pupal periods (marked in grey). See Supplementary Table S1 for statistics.

