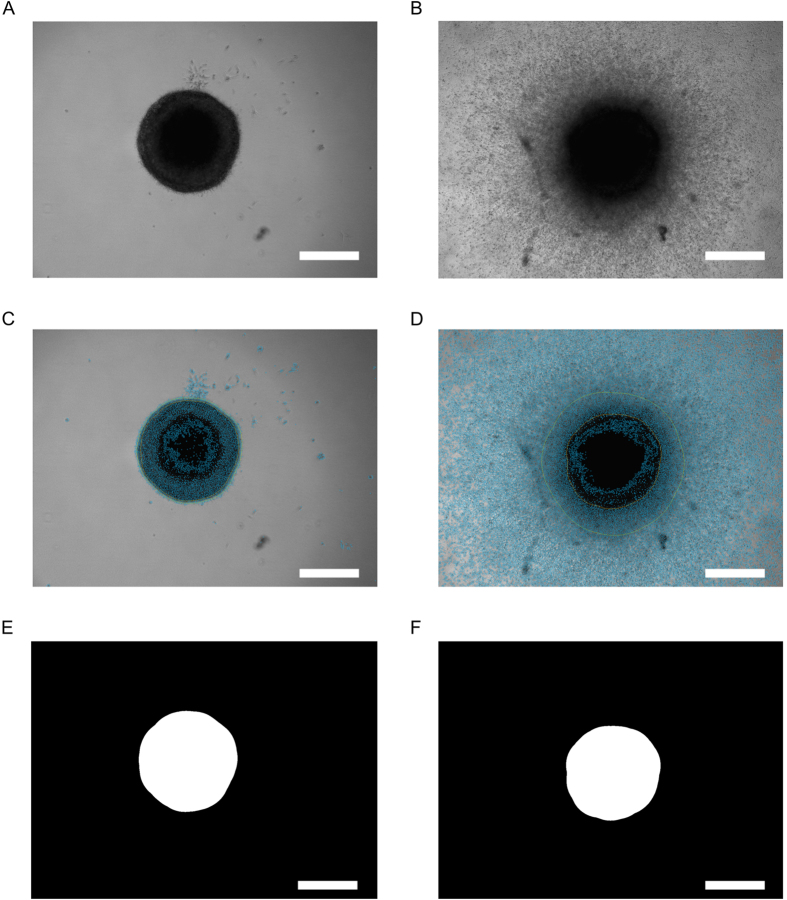
Figure 1. Core extraction.
(A,B) original micrographs of the MCTSs (U87MG cells) before image processing at the beginning (A, day 0) and at the end (B, day 8) of the invasion assay. (C,D) representation of the calculated MCTS features in overlay after image processing. The orange line depicts the core, the green line the halo and the blue color depicts the periphery of MCTS at day 1 (C) and day 8 (D). (E,F) results of the core extraction on the micrographs at day 0 (E) and day 8 (F). Representative micrographs of an MCTS are shown. Scale bar = 500 μm.

