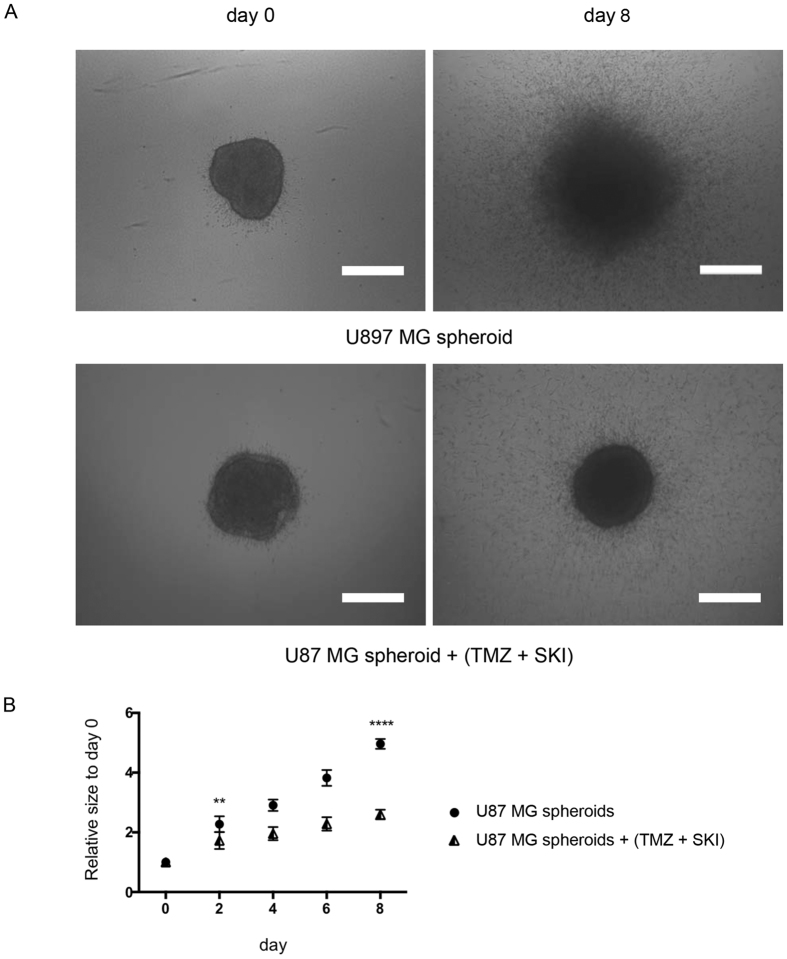
Figure 10. Invasion of tumor (U87MG) MCTS in the presence or absence of (25 μM TMZ + 10 μM SKI) treatment.
(A) Representative images of U87MG MCTS treated and untreated at day 0 and day 8. All images were acquired with an inverted light microscope at 4x magnification. Scale bar: 500 μm. (B) Quantification of invasiveness of U87MG MCTS. Data is expressed as mean ± standard deviation of the relative size of the MCTS of the indicated time. Results are from three independent experiments. **p < 0.01; ****p < 0.0001.

