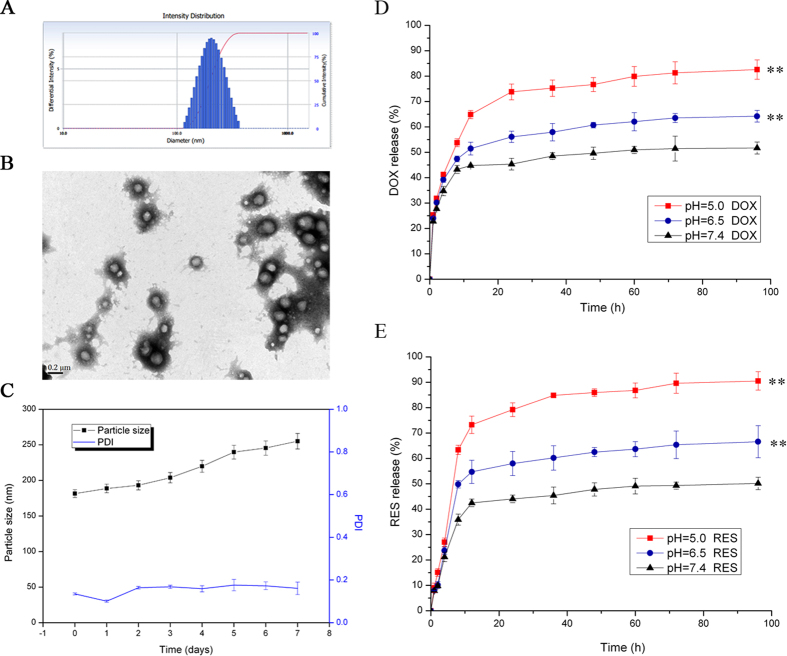
Figure 1. Characteristics of DOX-RES-loaded nanoparticles (NPS).
Panel (A) is particle size distribution of NPS measured by dynamic light scattering. Panel (B) is TEM image of NPS. Panel (C) are the changes of particle size and particle distribution index of NPS in PBS for 7 days at 37 °C, measured by dynamic light scattering. Panels (D,E) are in vitro DOX and RES release curve from DOX/RES-loaded NPS in different PBS (pH 5.0, pH6.5 and pH 7.4) at 37 °C. Data are mean ± SD. n = 3, **p < 0.01, vs pH 7.4 at 96 h. All experiments were tested for three times.

