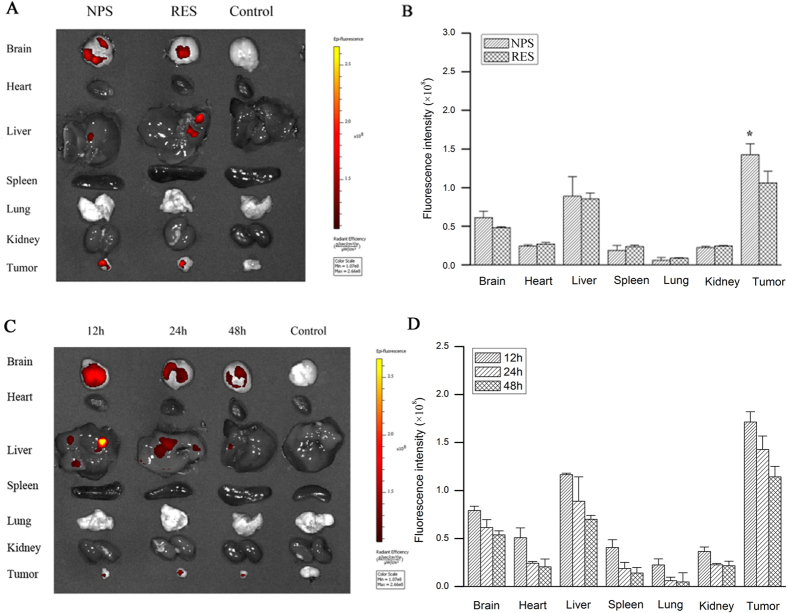
Figure 10.
Panel (A) is living image pictures of RES distribution at 24 h after DOX/RES-loaded NPS (10 mg DOX/kg, 30 mg RES/kg) and free RES (30 mg/kg) were administered by tailvein injection. Panel (B) is the quantitative analysis of RES distribution after NPS and free RES were administered by tail vein injection in 24 h. Panel (C) is living image pictures of RES distribution at 12 h, 24 h and 48 h after NPS were administered by tailvein injection. Panel (D) is the quantitative analysis of RES distribution after DOX/RES-loaded NPS were administered by tail vein injection in 12 h, 24 h and 48 h. Data are mean ± SD. n = 3, *p < 0.05, vs free RES.

