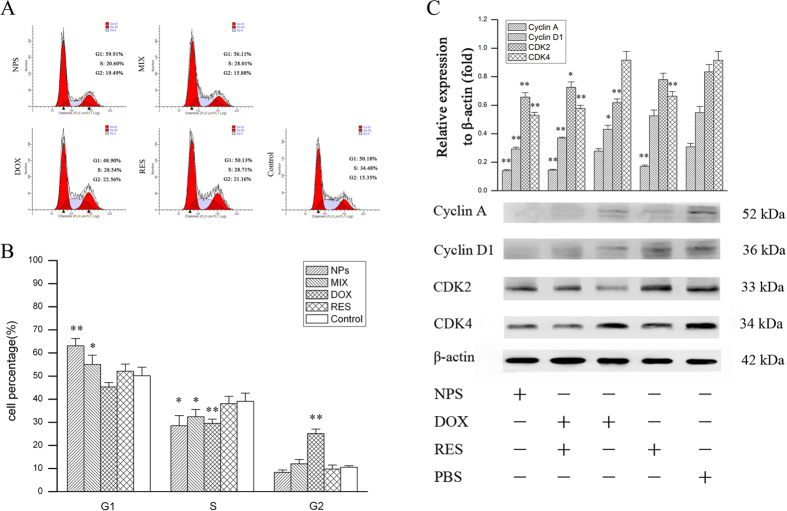
Figure 4. Cell cycle analysis after MDA-MB-231/ADR cells were cultured with free DOX, free RES, MIX and DOX/RES-loaded NPS for 24 h.
Panel (A) is the typical pictures of flow cytometry. Panel (B) is the statistic results of cell cycle. Panel (C) is the western blot analysis of cell cycle-related protein expression. Data are mean ± SD. n = 3, *p < 0.05, **p < 0.01, vs control or PBS.

