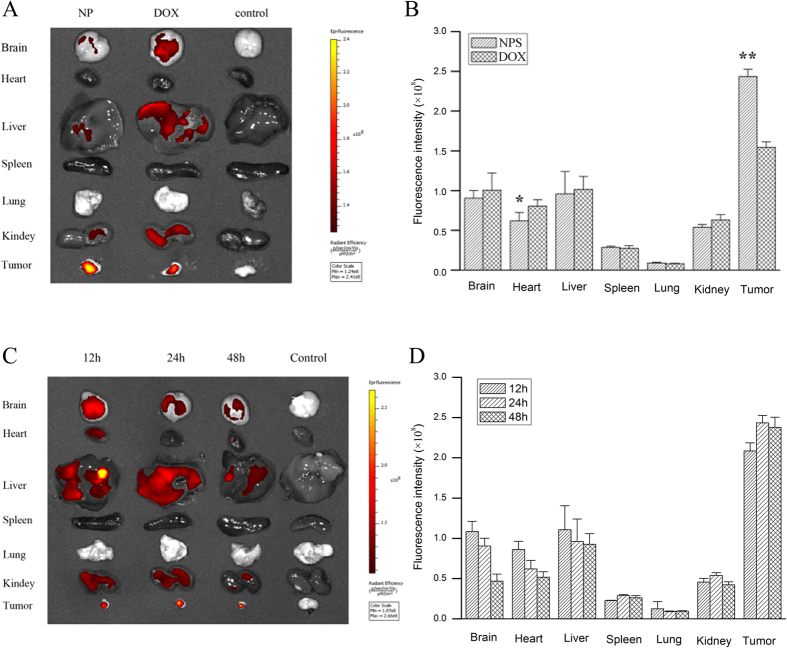
Figure 9.
Panel (A) is living image pictures of DOX distribution at 24 h after DOX/RES-loaded NPS (10 mg DOX/kg, 30 mg RES/kg) and free DOX (10 mg/kg) were administered by tailvein injection. Panel (B) is the quantitative analysis of DOX distribution after DOX/RES-loaded NPS and free DOX were administered by tail vein injection in 24 h. Panel (C) is living image pictures of DOX distribution at 12 h, 24 h and 48 h after DOX/RES-loaded NPS were administered by tailvein injection. Panel (D) is the quantitative analysis of DOX distribution after NPS were administered by tail vein injection in 12 h, 24 h and 48 h. Data are mean ± SD. n = 3, *p < 0.05, **p < 0.01, vs free DOX.

