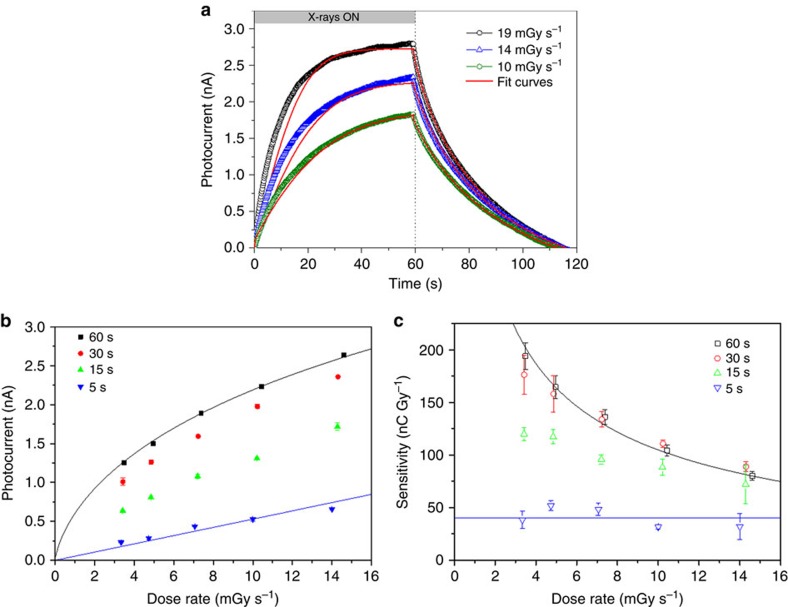
Figure 3. Dynamics of X-ray response and consequences on detector operation.
(a) Experimental and simulated curves of the dynamic response of the detector for three different dose rates of the radiation. The experimental data refer to 60 s of exposure of the device (W=48 mm, L=30 μm, bias 0.2 V) to a synchrotron 17 keV X-ray beam, with a bias of 0.2 V. (b) Photocurrent versus Dose rate plot (scattered points) recorded for different exposure times of the device to a synchrotron monochromatic X-ray beam at 17 keV and biasing the device at 0.2 V. (c) Sensitivity values, founded differentiating the photocurrent data in function of dose rate (reported in a), versus dose rate for different time exposures of the device to the radiation. Solid lines in (a–c) represent fits to the data according to the analytical model described in the text. The error bars in c are calculated by means of error propagation theory from errors of experimental data reported in b.

